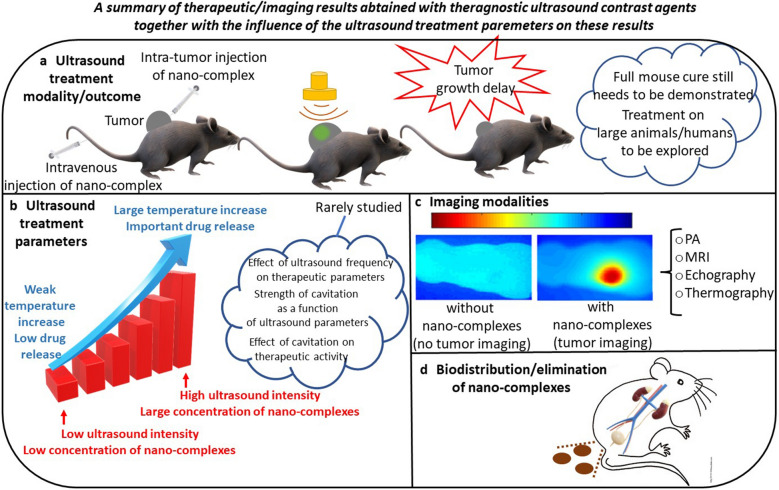
Fig. 3.
Schematic diagrams representing: a the therapeutic outcome of tumor treatments obtained on mice administered with nano-systems and exposed to ultrasounds, b the strength of various parameters (temperature increase, drug release, ROS production) influencing anti-tumor activity as a function of ultrasound intensity, as reported in some specific cases, c the different imaging modalities that could be implemented during a cancer treatment with NS exposed to ultrasounds, d NS biodistribution ending by NS elimination, as reported in some specific cases

