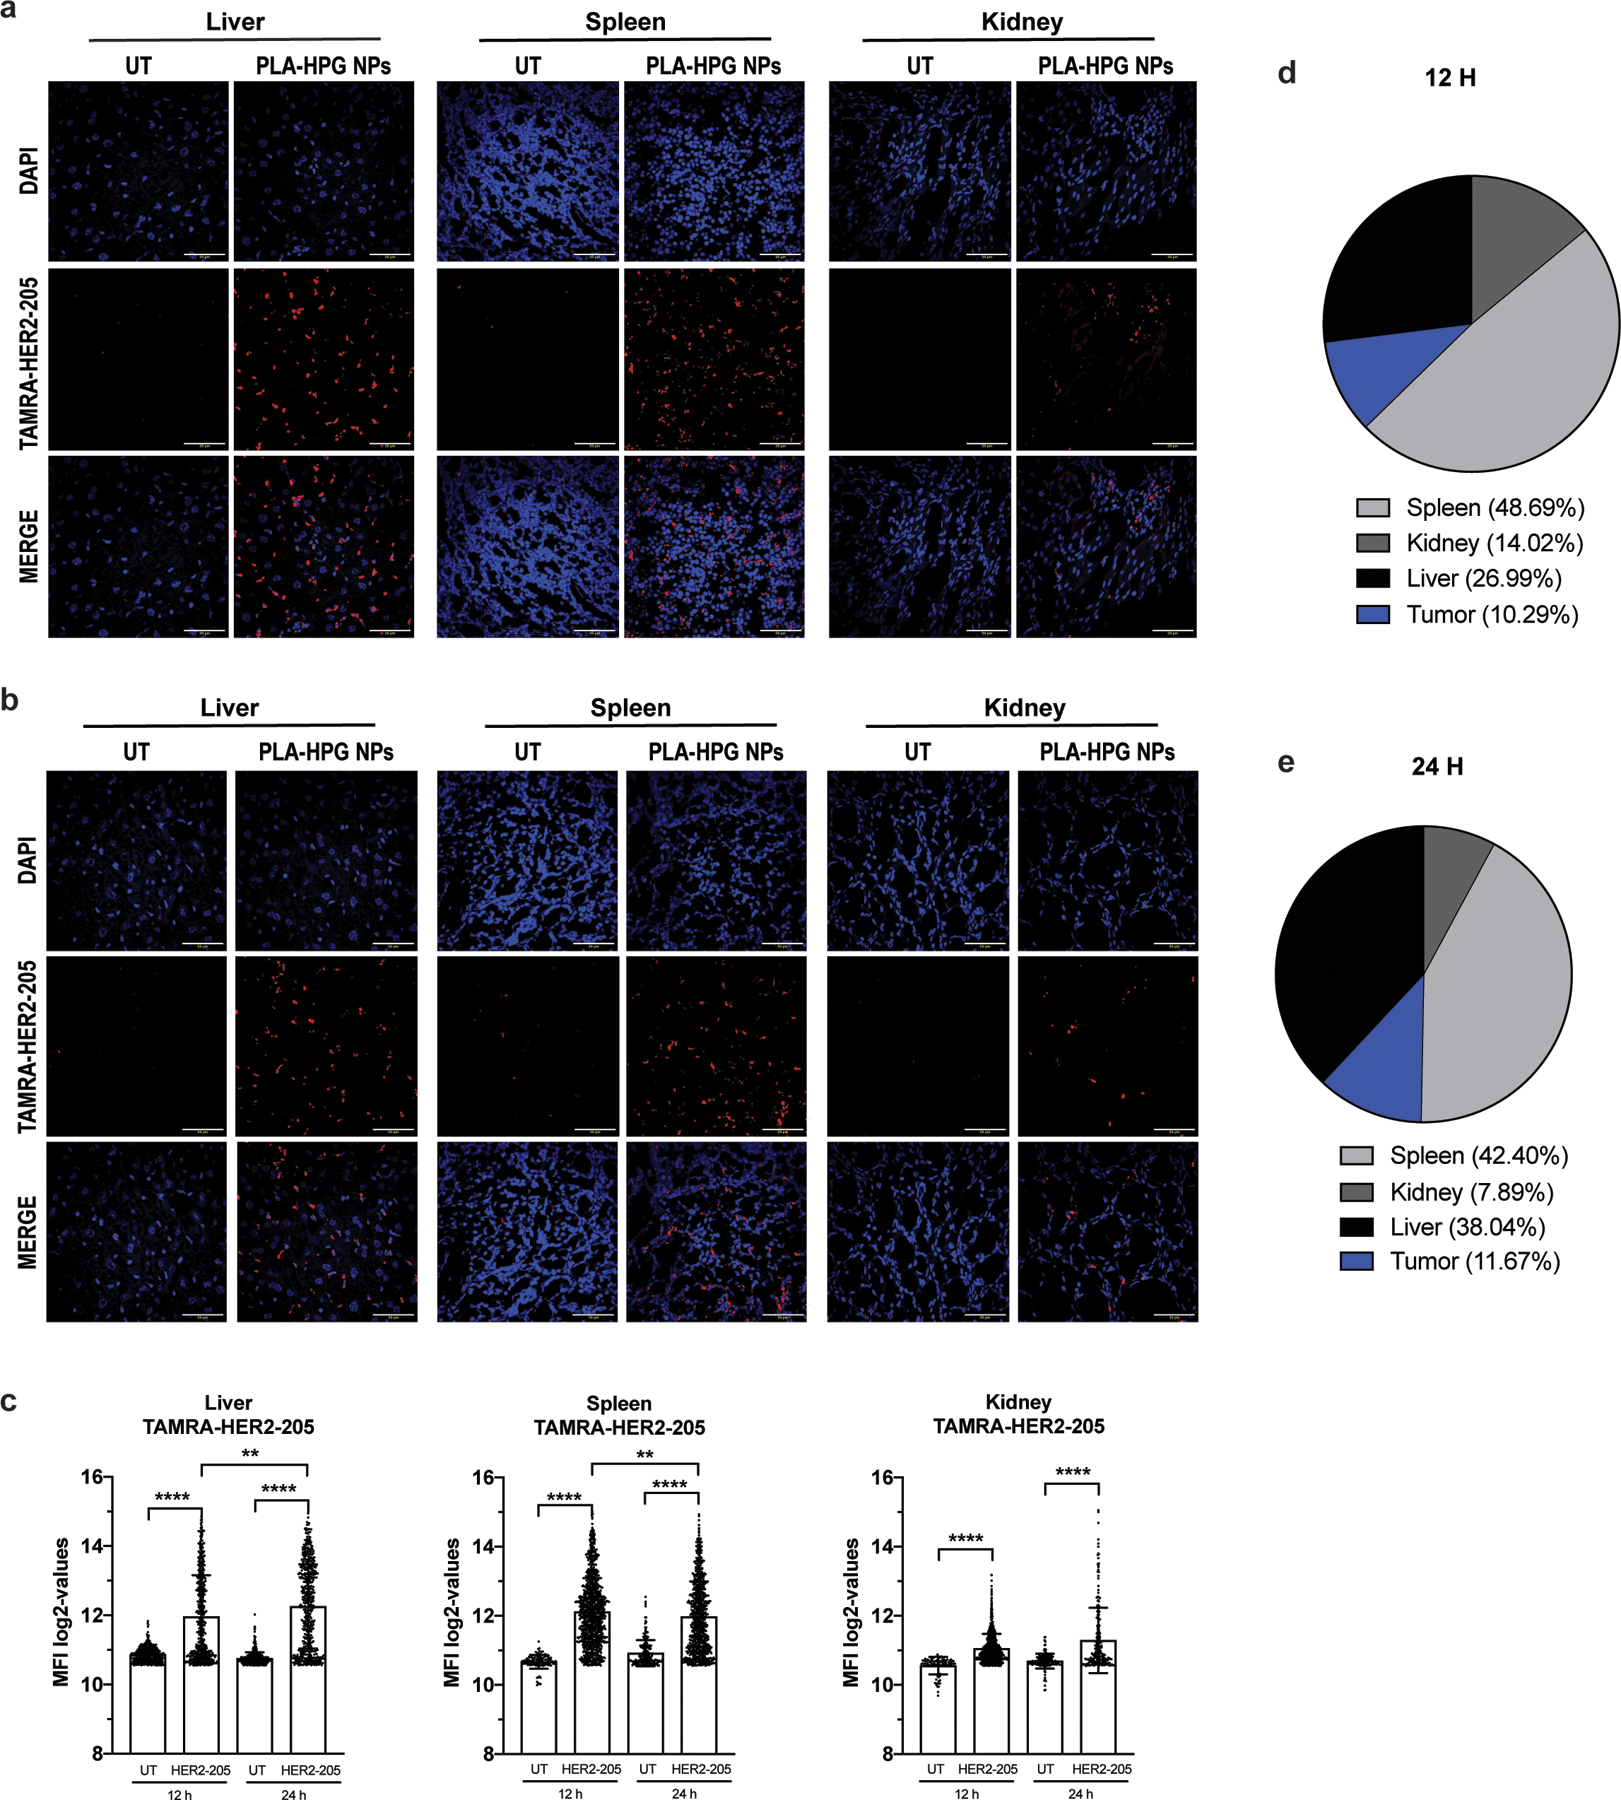
Extended Data Figure 4.

Biodistribution of TAMRA-HER2–205 encapsulated PLA-HPG nanoparticles (NPs). (a) Representative confocal images of tissue sections 12 hours post intravenous administration via retro-orbital injection of a 2mg dose of NPs (scale bars, 50 μm). (b) Representative confocal images of TAMRA-HER2–205 biodistribution in tissues 24 hours post treatment (scale bars, 50 μm). (c) TAMRA fluorescence was quantified at both 12 and 24 hours after dosing (2mg of NPs) and TFO uptake in each tissue is reported as mean fluorescence intensity (MFI) (mean ± SEM, n= 2 mice). Statistical significance was calculated by one-way ANOVA and Kruskal-Wallis test (****P<0.0001, **P<0.01). (d) Analysis of TAMRA-HER2–205 biodistribution 12 h post treatment. Fluorescence intensity observed in each tissue is reported as a percentage of the combined total fluorescence intensity detected in spleen, kidney, liver and tumor (tumor data is shown and quantified in Fig. 6a, b). Total area of the pie chart denotes the sum of the absolute fluorescence within the four organs, representing the total TFO uptake by these organs, and each slice gives the relative HER2–205 uptake for each organ. (e) Analysis of TAMRA-HER2–205 biodistribution 24 h post systemic administration. Fluorescence intensity observed in each tissue is reported as a percentage of the combined total fluorescence intensity detected in spleen, kidney, liver and tumor (tumor data is shown and quantified in Fig. 6a, b). Total area of the pie chart denotes the sum of the absolute fluorescence within the four organs, representing the total TFO uptake by these organs, and each slice gives the relative HER2–205 uptake for each organ.
