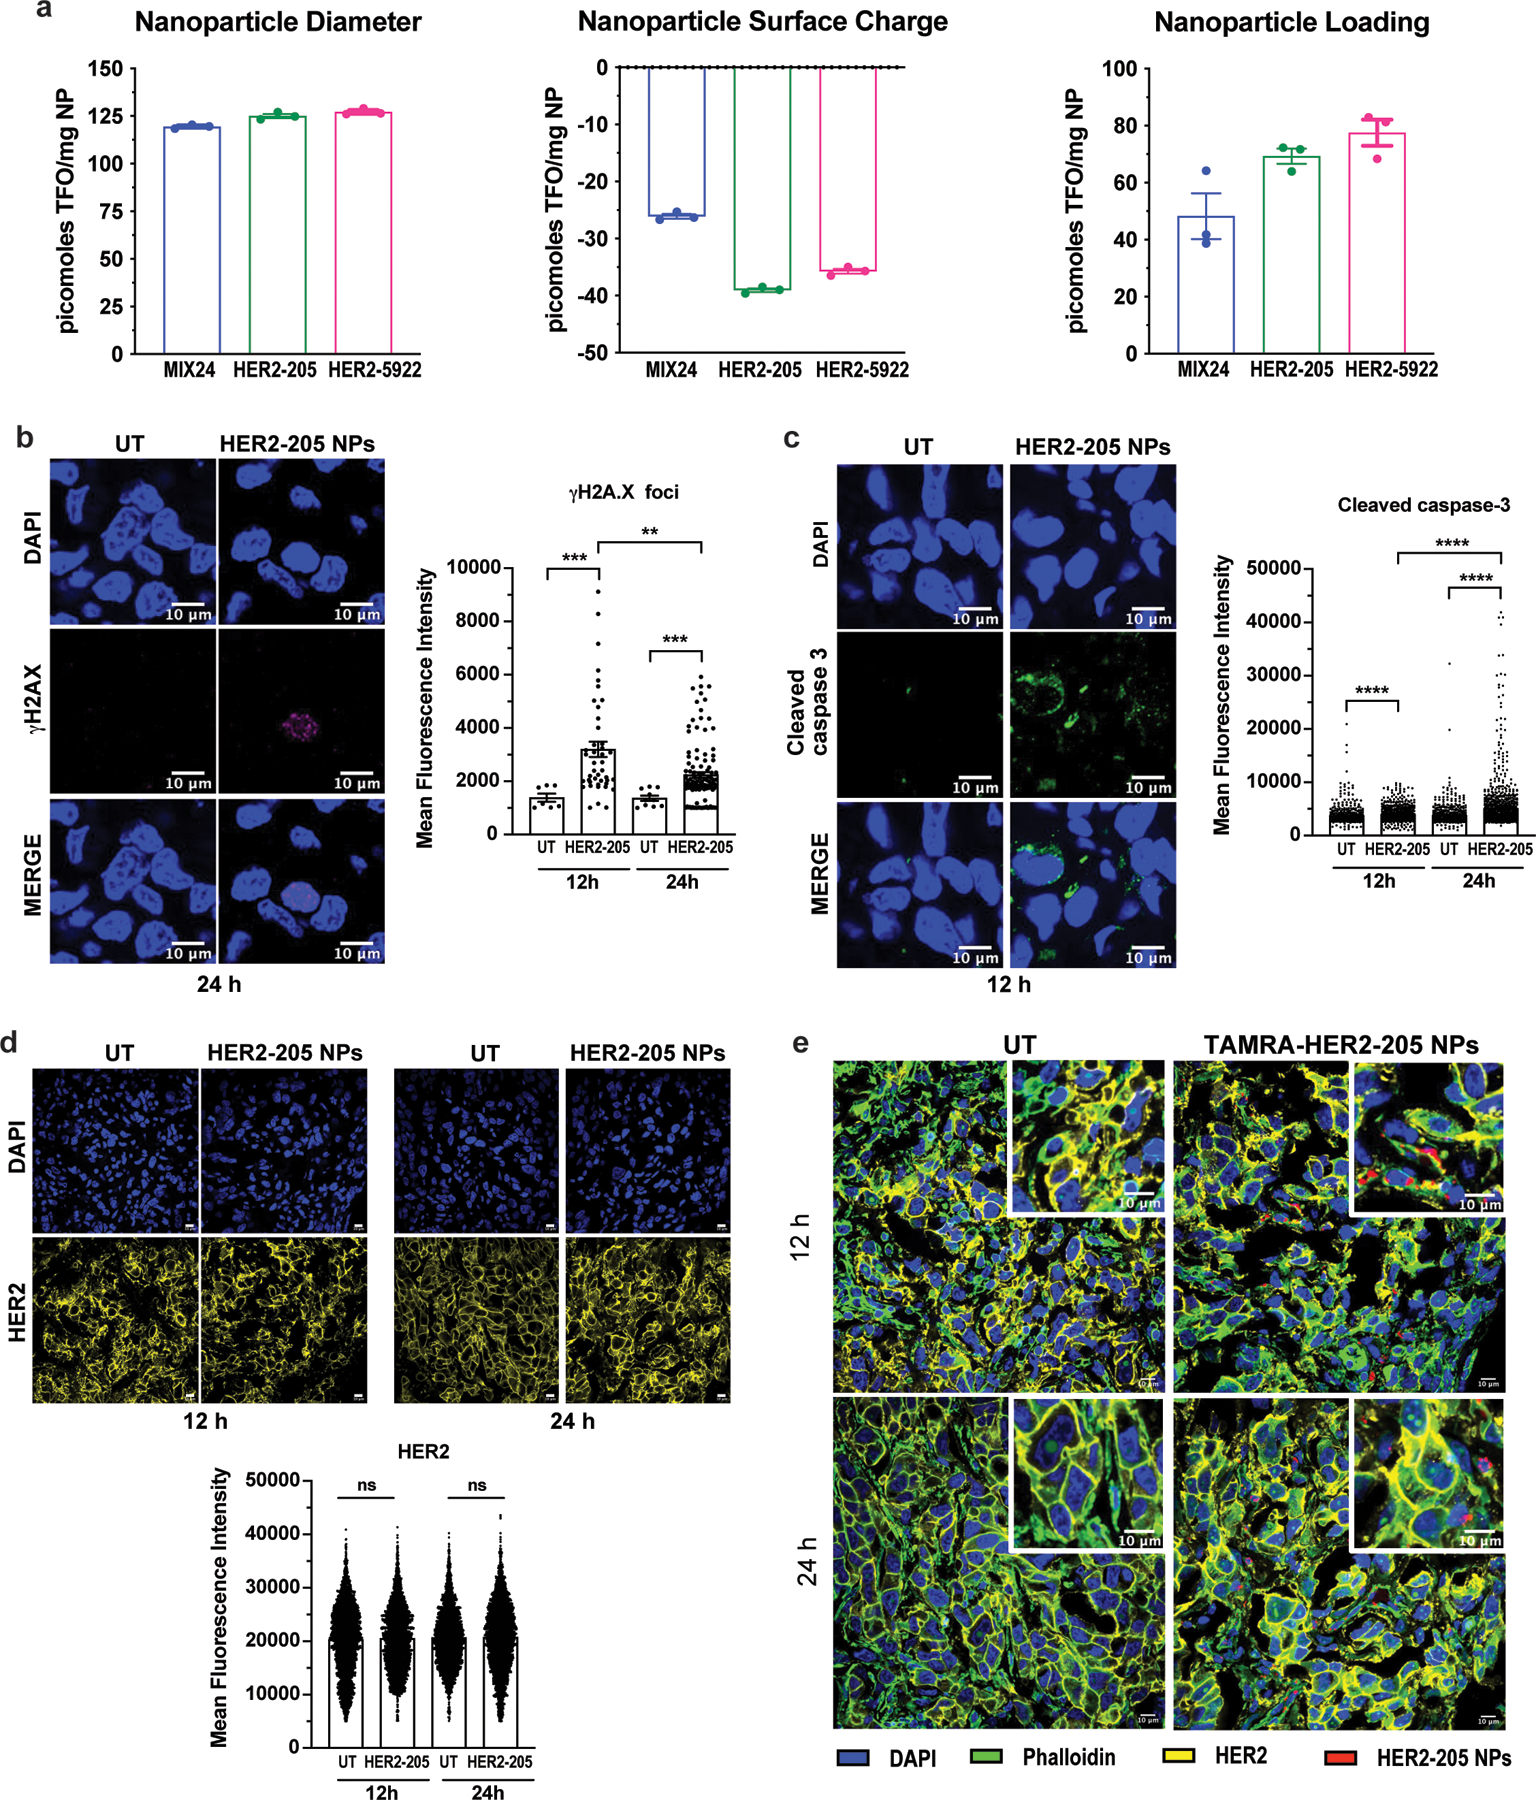
Extended Data Figure 5.

(a) Nanoparticle Characterization. Nanoparticle diameter as measured by dynamic light scattering. Nanoparticle surface charge measured by zeta potential. Nanoparticle loading of TFOs measured by extraction and analysis. All data is plotted as mean ± SEM, n=3 experiments. (b) Representative images of confocal microscopy of γH2AX immunofluorescence in tumors 24h post-treatment with HER2–205 PLA-HPG NPs and quantification of γH2AX foci is reported as mean fluorescence intensity (MFI) (mean ± SEM; Kolmogorov-Smirnov test; ***P<0.001, **P<0.01; n=4 tumors/timepoint; scale bars, 10μm). (c) Representative images of confocal microscopy of cleaved caspase 3 immunofluorescence in tumors 12h post-treatment with HER2–205 PLA-HPG NPs and quantification of activated caspase 3 is reported as mean fluorescence intensity (mean ± SEM; Kolmogorov-Smirnov test; ****P<0.0001; n=4 tumors/timepoint; scale bars, 10μm). (d) HER2 immunofluorescence analysis of BT474 tumor sections from mice 12h and 24h after treatment with a single dose of HER2–205 PLA-HPG NPs (2 mg). Data represented as mean ± SEM and analyzed by one-way ANOVA Kruskal-Wallis test (n= 4 tumors/time point; ns, not significant). Scale bar, 10μm. (e) Confocal microscopy images of tumor sections analyzed by immunofluorescence 12h and 24h following a single dose of TAMRA-HER2–205 PLA-HPG NPs (scale bars, 10μm).
