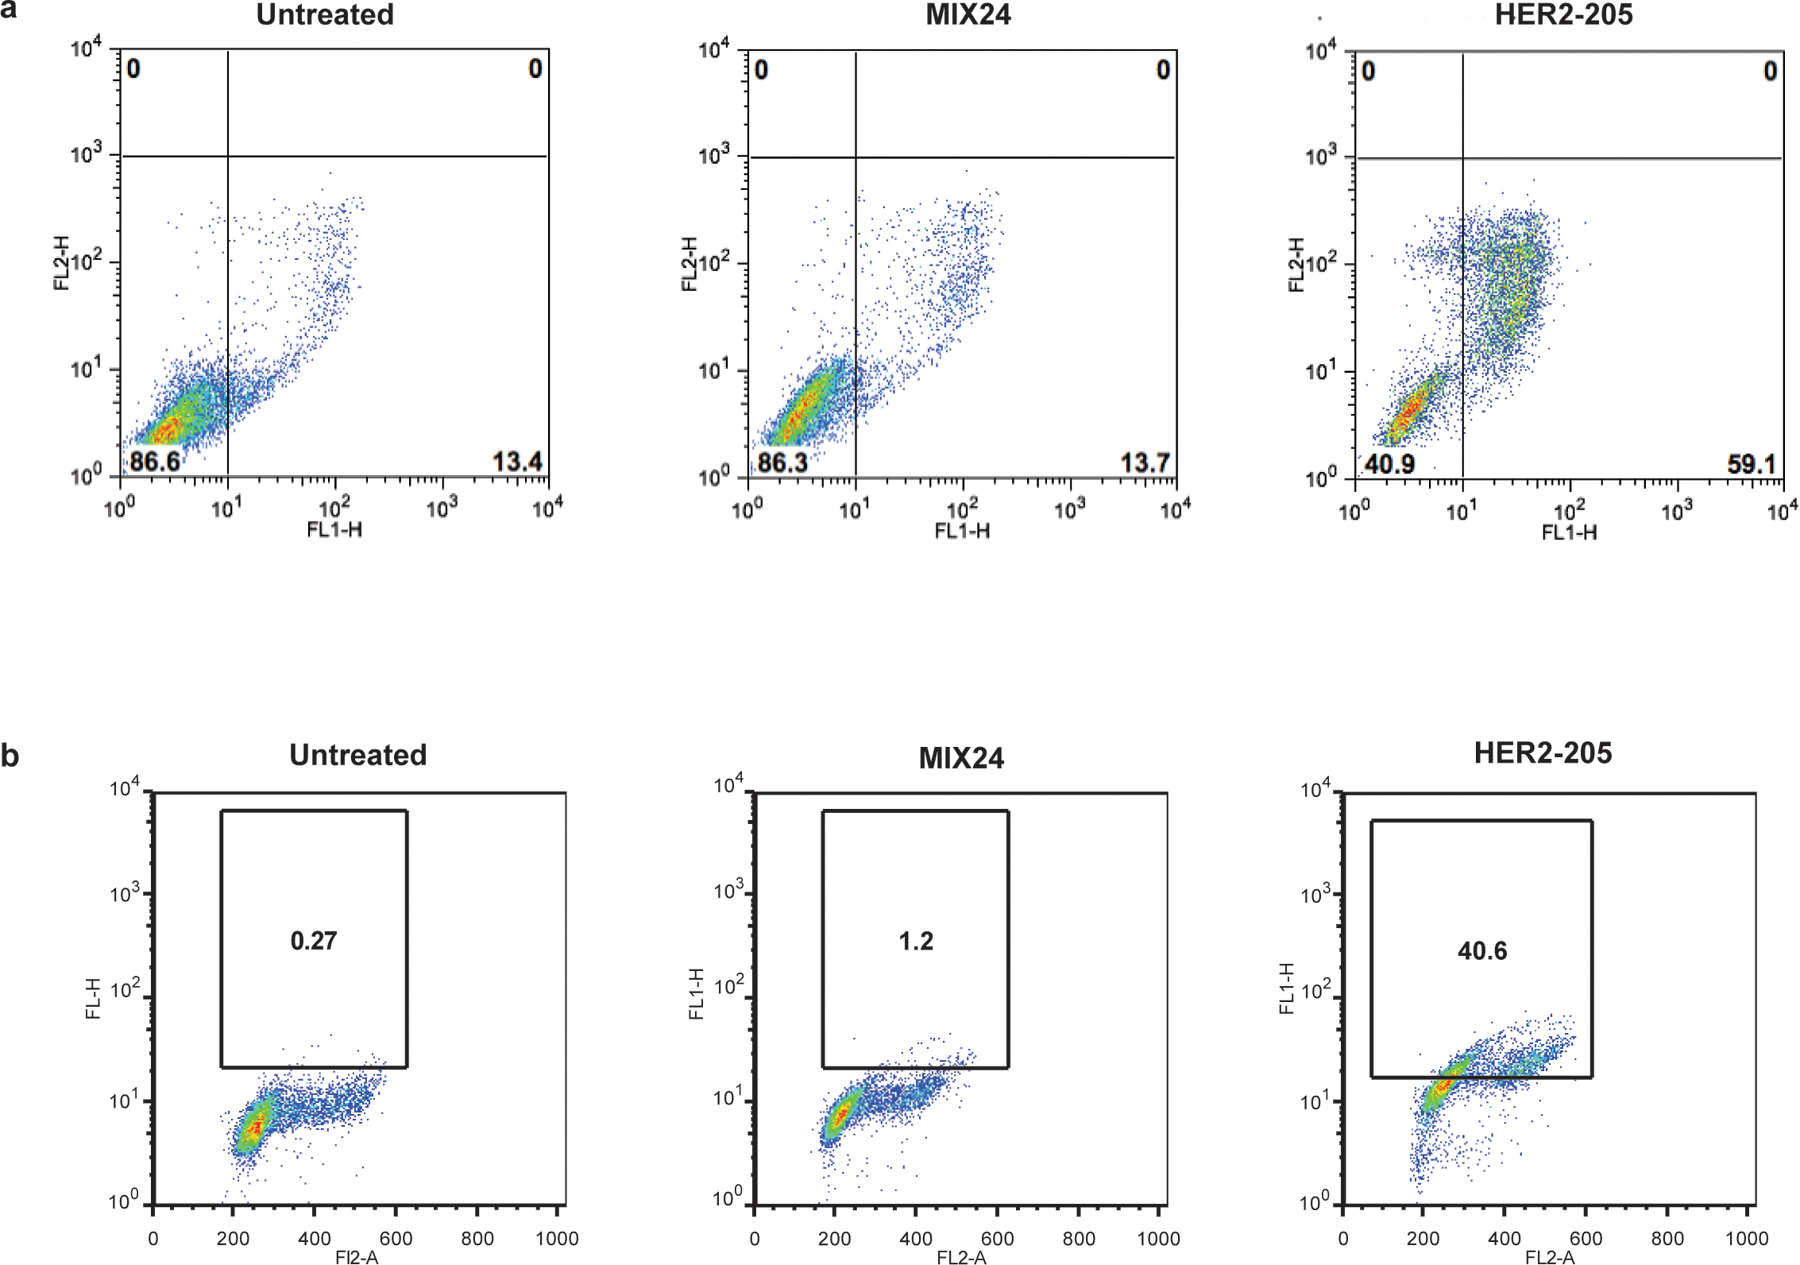
Extended Data Figure 7.

A single cell homogeneous population was utilized for FCS/SSC gating of the starting cell population. (a) Flow cytometry profiles of BT474 cells stained for Annexin V-FITC/PI to measure apoptotic cells. Cells were harvested 24h after treatment. Lower right quadrant represents the combined percentage of early and late apoptotic cells. (b) Flow cytometry profiles of BT474 cells stained for pATM. Cells were harvested 24h after treatment. The box indicates the gate for high levels of pATM and numbers represent percentage of cells with high levels of pATM.
