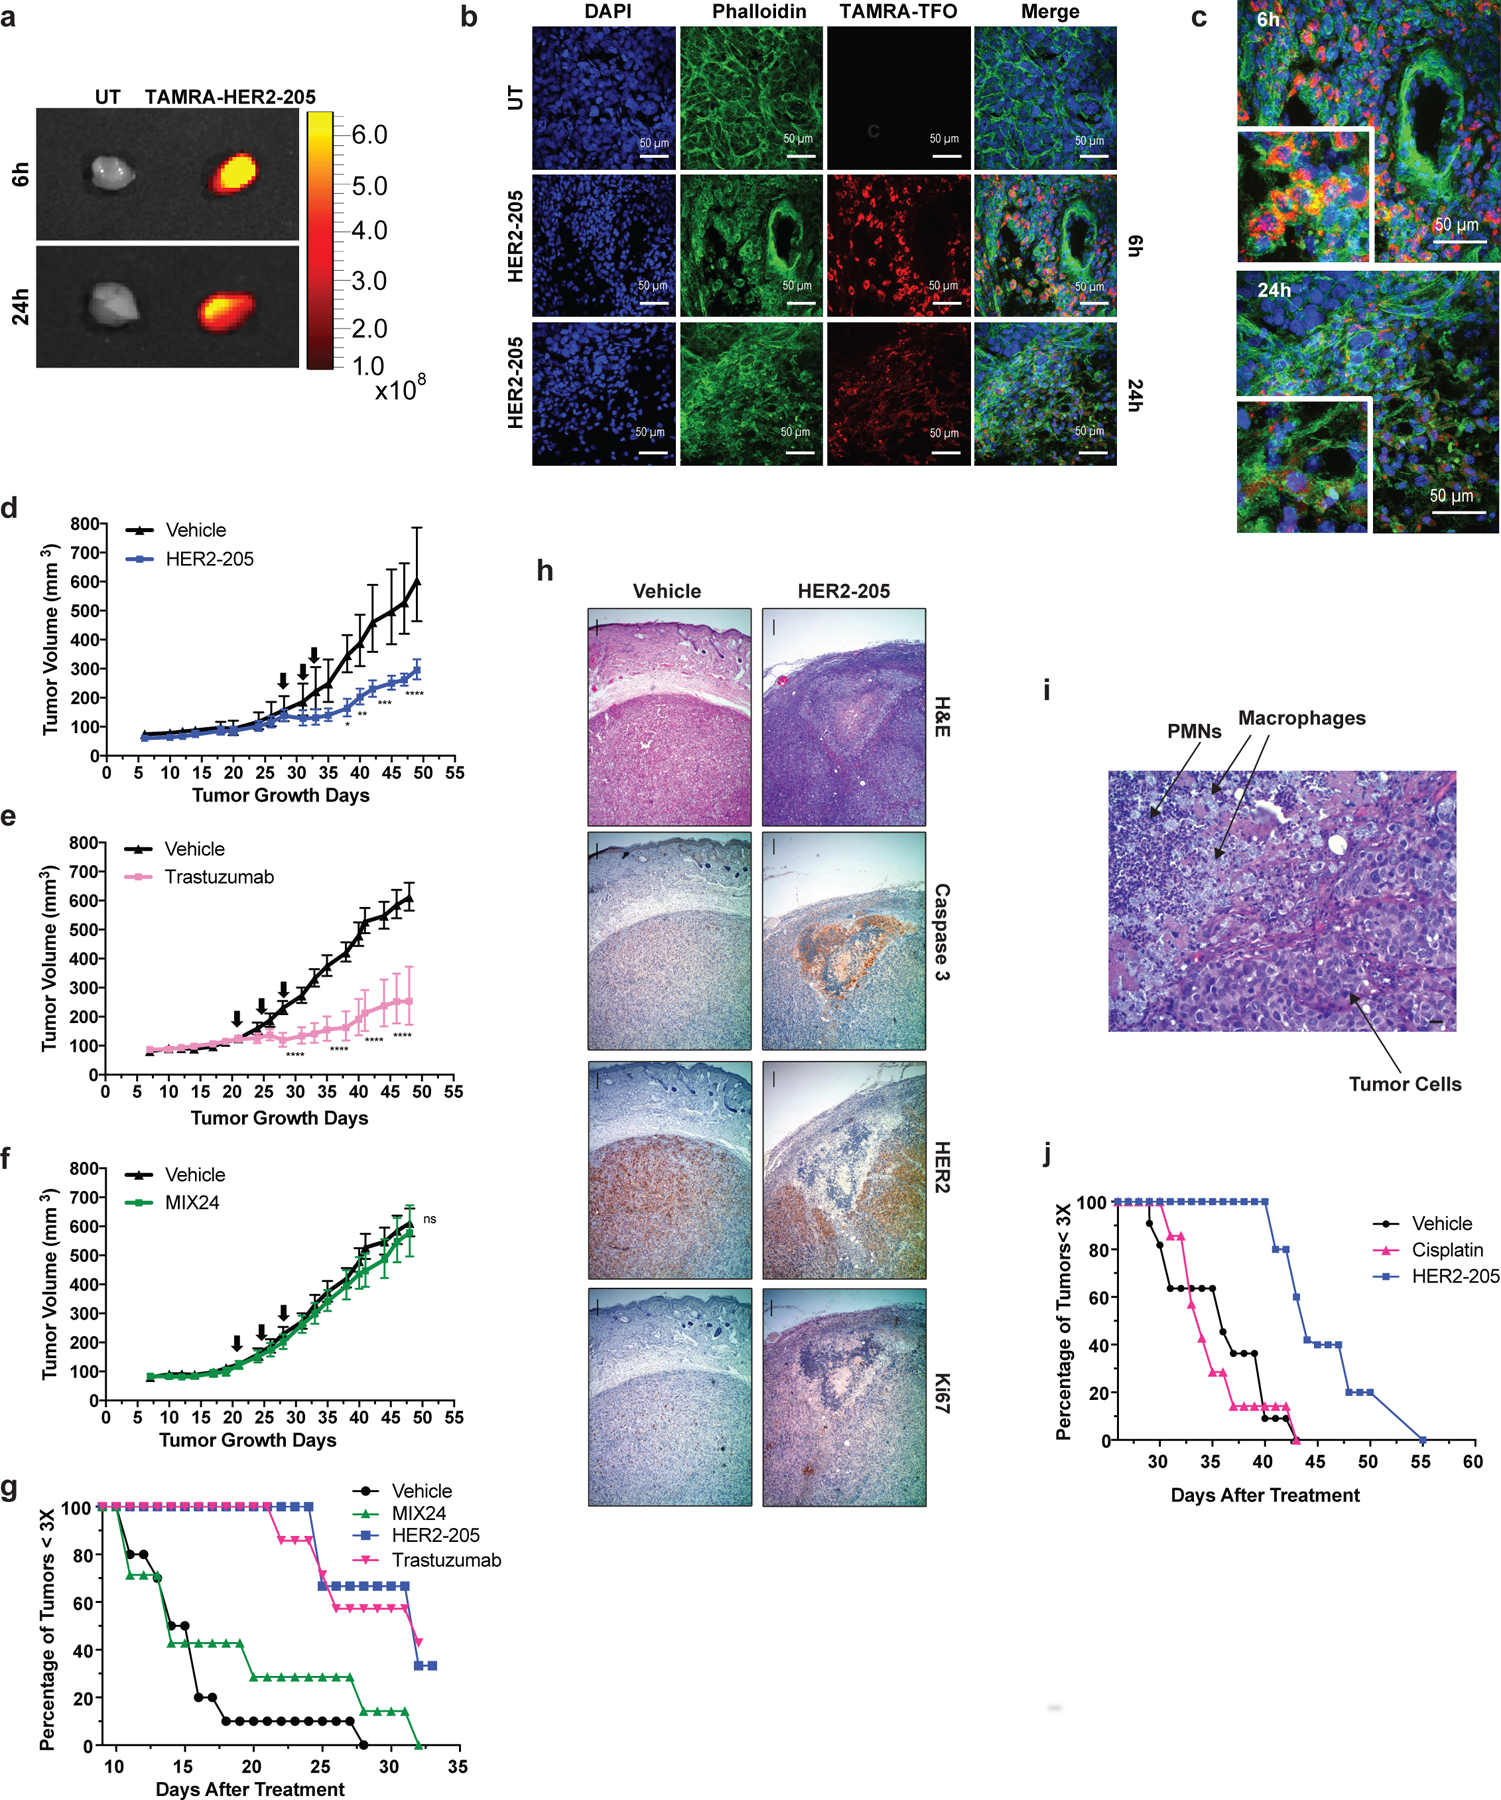
Figure 3. In vivo effect of HER2–205 on human HER2-positive cancer xenografts.

(a) Ex vivo fluorescence imaging of TAMRA-HER2–205 uptake in tumors harvested 6h and 24h post IP injection. (b) Confocal microscopy imaging of tumor tissue from mice treated with TAMRA-HER2–205 (20 mg/kg). Representative images of tumors sections at 6h (n=2 tumors) and 24h (n=2 tumors) post dosing. (c) Tumor sections visualize DAPI (blue), phalloidin (green) and HER2–205 (red) following a single dose of TAMRA-HER2–205 (20 mg/kg). (d) Tumor growth delay curves of BT474 xenografts generated by subcutaneous injection of female athymic nude mice. Twenty-eight days after implantation mice were treated by IP injection with three 20 mg/kg doses (evenly administered over 7 days) (d) HER2–205, n= 5 (e) trastuzumab, n= 8 and (f) MIX24, n= 8. Arrows indicate administration of doses. Tumor growth measurements are presented as mean ± SEM shown and analyzed by two-way ANOVA with Sidak test post-hoc. ****P<0.0001, ***P<0.001, **P<0.01, *P<0.05, ns, not significant. (g) Kaplan-Meier plots of the percentage of tumors smaller than three times baseline size. Baseline size was defined as tumor size on the first day of treatment [Day 28 in (d) and Day 21 in (e) and (f)]. (h) Histopathologic analysis of BT474 tumor sections from mice 24h after treatment with a single dose of HER2–205 (20 mg/kg body weight) or vehicle. Haematoxylin and eosin (H&E), caspase 3, HER2, Ki67 stain at 4X magnification (scale 10µm). (i) Higher magnification of H&E tumor section from HER2–205 treatment specimen (scale 10µm). (j) Kaplan-Meier plot of the percentage of SKOV3 ovarian cancer tumors smaller than three times baseline size. Mice were treated with 3 doses of HER2–205 (n=5) at a concentration of 20 mg/kg or cisplatin (n=7) at a concentration of 10 mg/kg.
