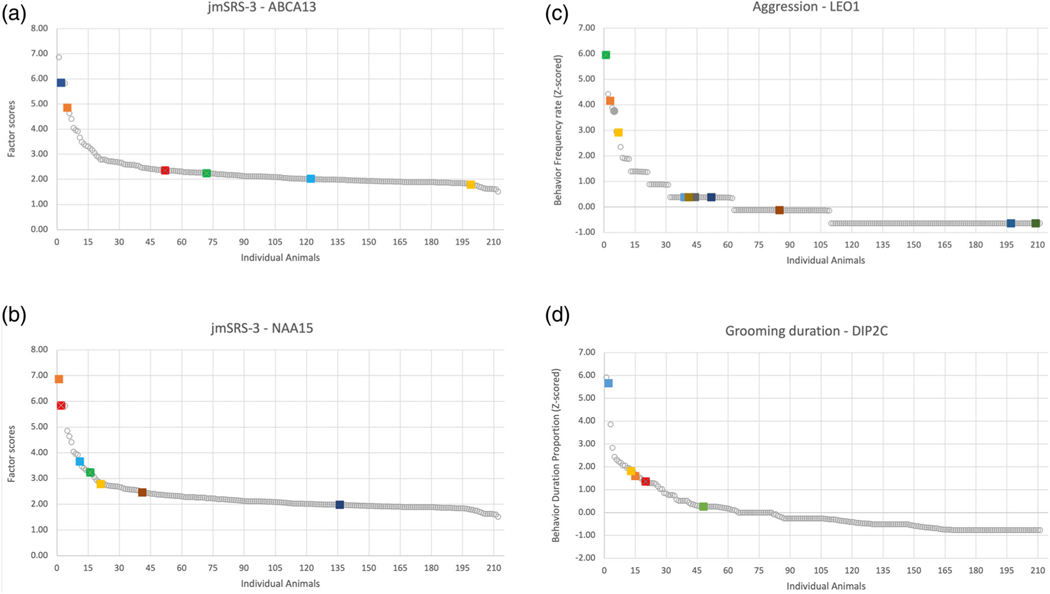
FIGURE 1.
Individual animal scores on specific behaviors or factors. (a) Population distribution of scores on the jmSRS-3, where animals with the alternate T allele in ABCA13 at position 3:60389877 are highlighted. (b) Population distribution of scores on the jmSRS-3, where animals with the alternate A allele at position 5:139396723 for NAA15 allele are highlighted. (c) Population distribution of behavioral frequency rate for aggression where animals with the alternate T allele in LEO1, position 7:28322629 are highlighted. (d) Population distribution of behavior duration proportion for grooming duration, where animals with the C allele in DIP2C, position 9:287974 are highlighted

