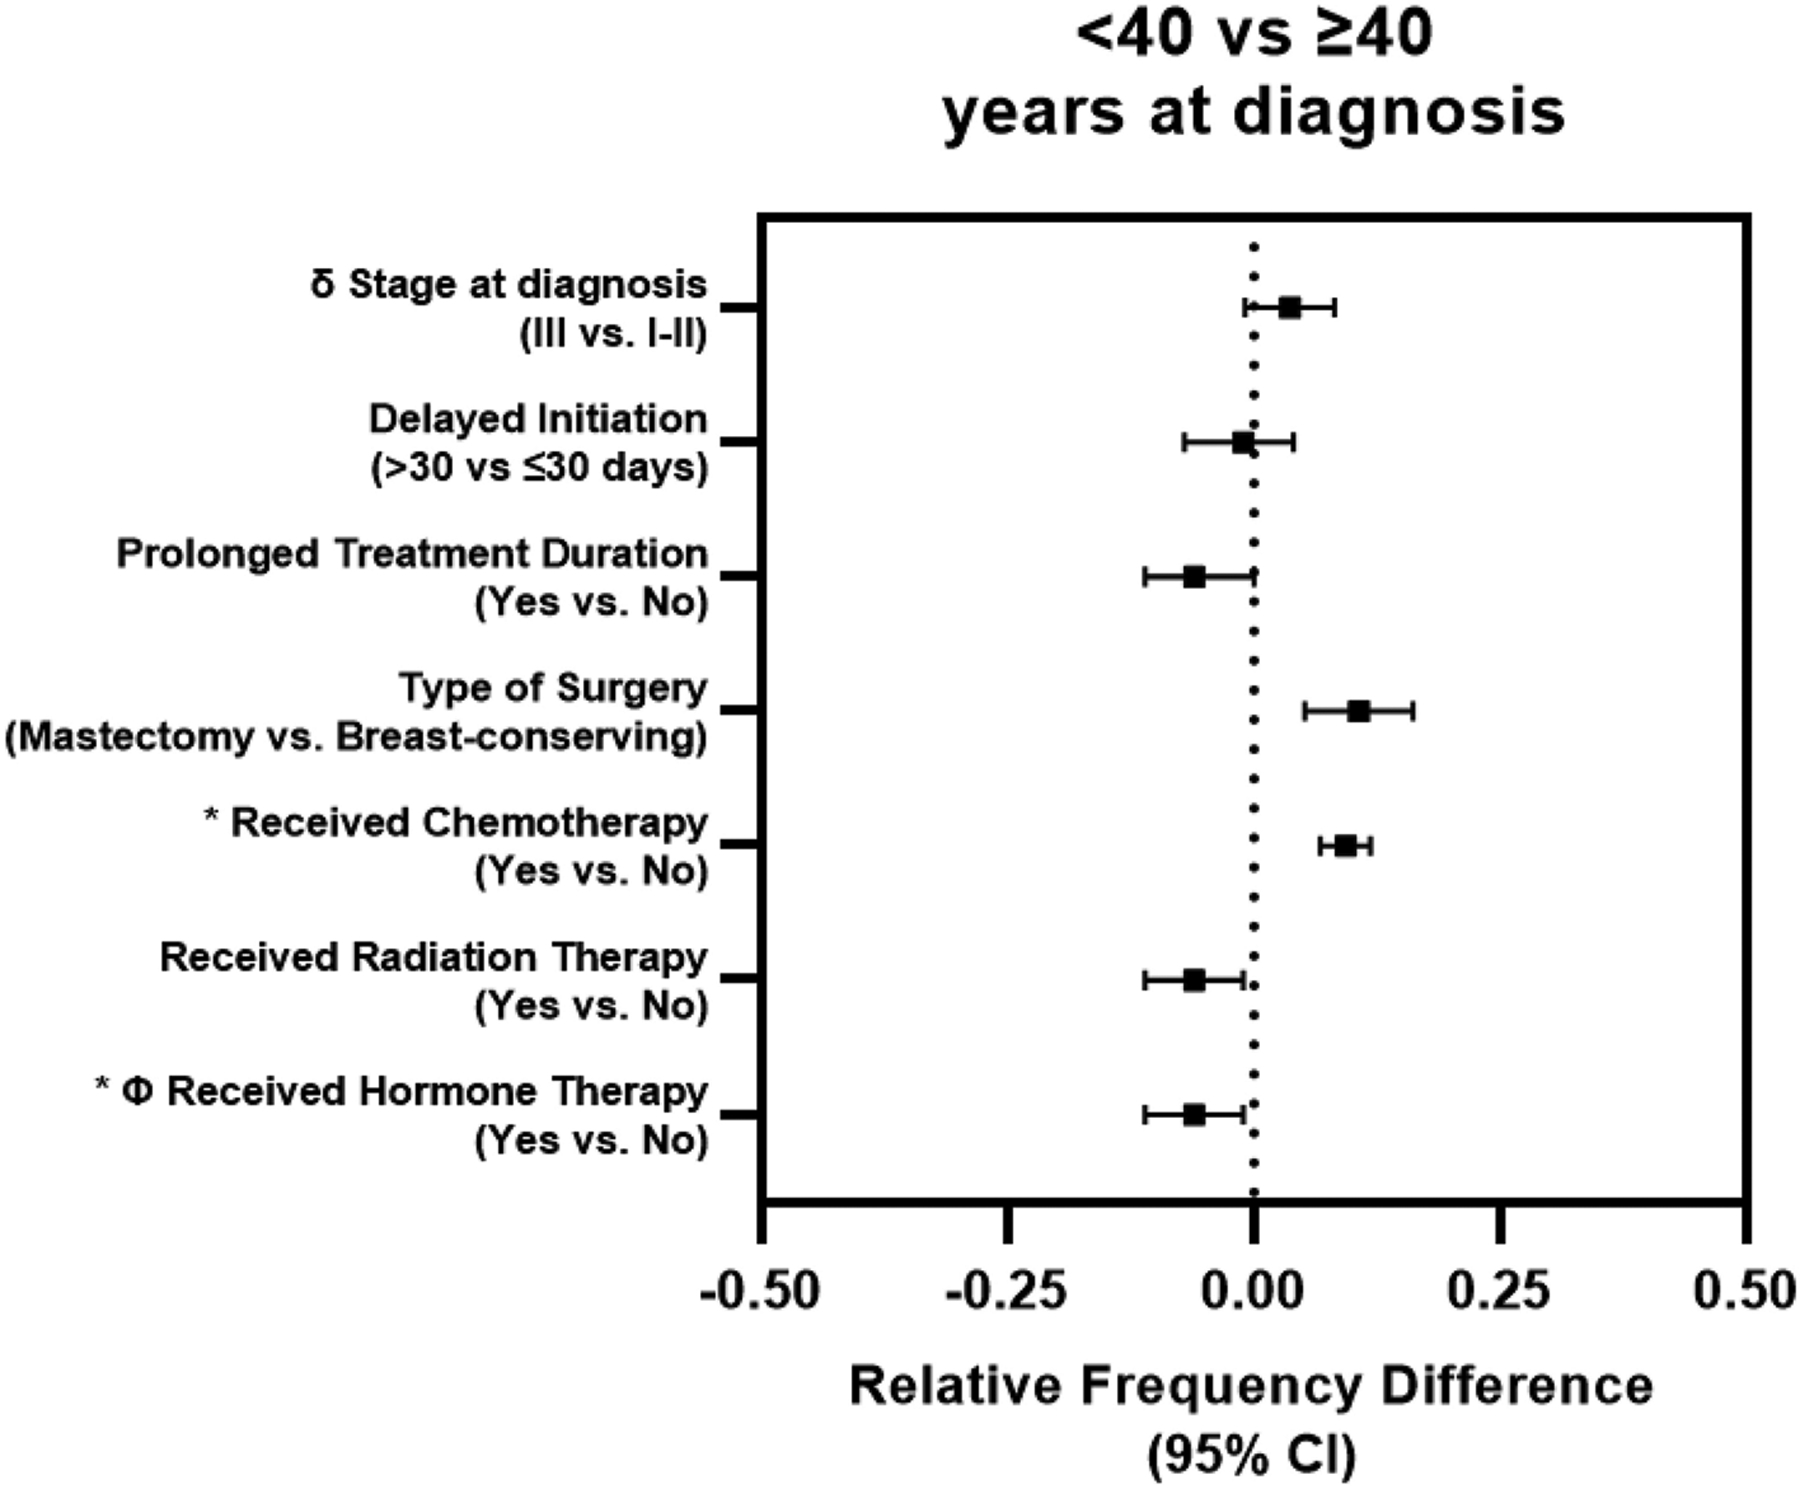
Figure 3: Associations between tumor stage at diagnosis & treatment-related factors and young age at diagnosis.

Forest plot of relative frequency difference for tumor stage at diagnosis, treatment time-related factors and treatment received between cases diagnosed at <40 vs. ≥40 years of age. δ Stage model adjusted for age, race, income, education, marital status and health insurance status at baseline. Treatment time-related factors and treatment received adjusted for race, tumor stage, size, grade, lymph node status, hormone receptor status and human epidermal growth factor receptor 2 status; * only adjusted for race, tumor stage and lymph node status due to small number of untreated cases. Φ Includes only ER positive and borderline cases (≥1% cell positivity). CI: confidence interval.
