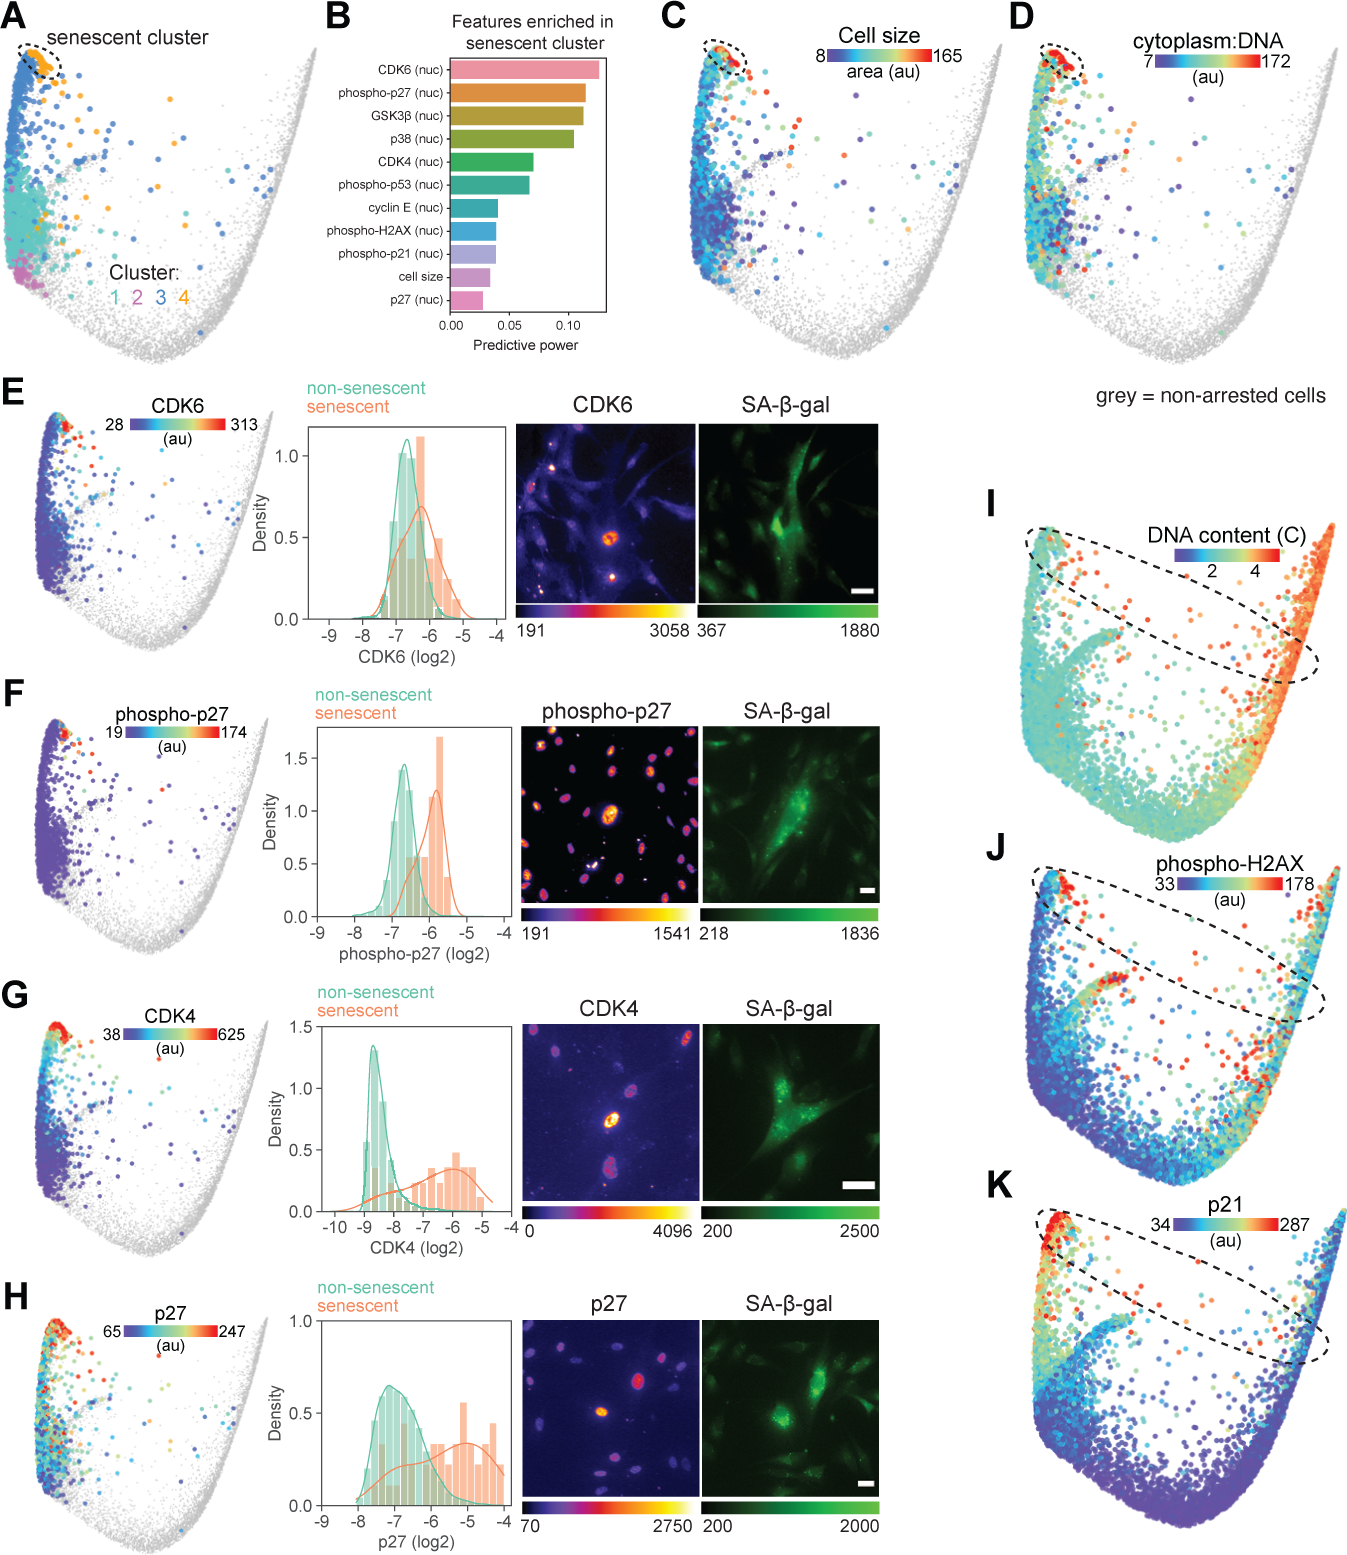
Figure 5. Molecular signature of cellular senescence.

(A) Graph-based clustering of arrested cells mapped onto the cell cycle structure. Senescent cells are found in cluster 4. (B) List of features with the highest predictive power in a random forest model trained to identify senescent cells (cluster 4) from the rest of the population. (C-D) Cell area (C) and ratio of cytoplasmic area:DNA content (D) mapped onto arrested cells. (E-H) Validated features of senescent cells mapped onto the arrest trajectory of the cell cycle structure (left panels), single-cell distributions of log2-normalized feature intensity in non-senescent (β-galactosidase (β-gal)-negative, green) and senescent (β-gal-positive, orange) cells (middle panels), and representative images of feature and β-gal staining of senescent cells (right panels). All senescent features shown here (and in Figure S6) showed significant differences in feature intensity between non-senescent and senescent populations (p<0.01 using an unpaired Welch t test with unequal variance). (I-K) DNA content (I) and nuclear median intensity of phospho-H2AX (J) and p21 (K) mapped onto the structure. Scale bar = 40 μm. Non-arrested cells (phospho/total RB > 1.6) are shown in grey on cell cycle structures.
