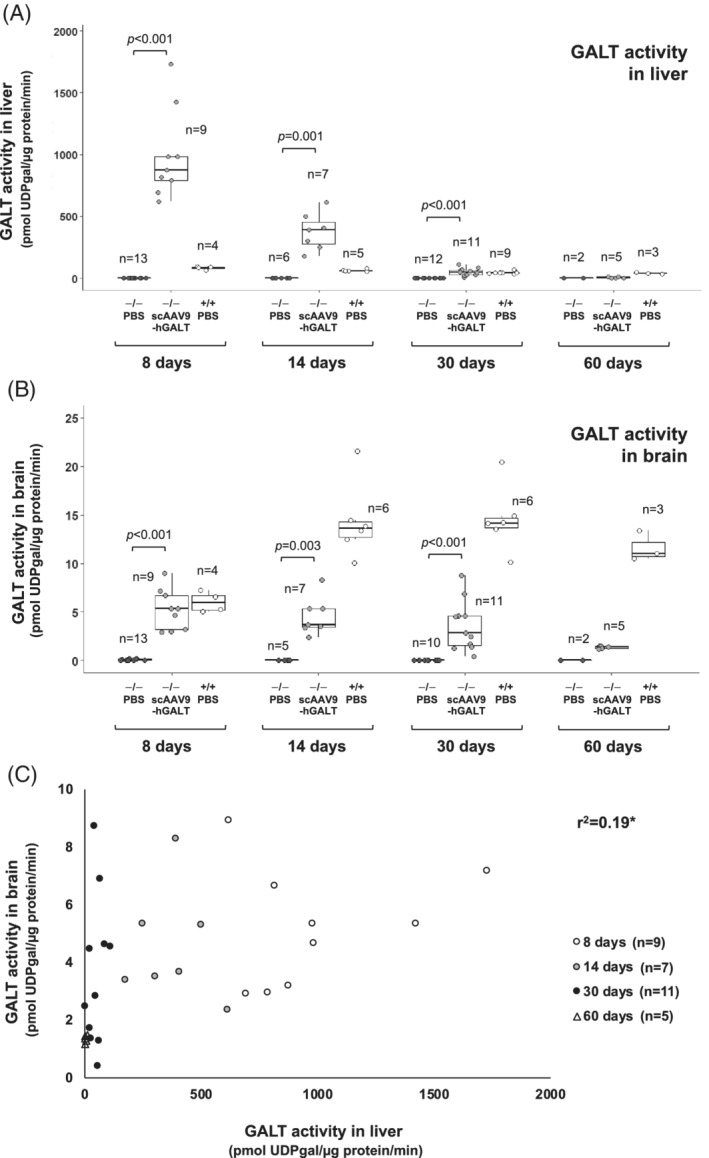
FIGURE 1.

GALT activity over time in tissues from treated and control rats. Box and whisker plots show GALT activity in liver (panel A) and brain (panel B) from PBS‐treated GALT‐null rats (black symbols), scAAV9‐hGALT‐treated GALT‐null rats (gray symbols), and PBS‐treated wild‐type rats (white symbols). The top and bottom of each box represent the 75th and 25th percentiles, respectively, the middle line in each box represents the median for that set. The whiskers, if any, represent the maximum and minimum values in the data set within 1.5 interquartile range (IQR) of the upper and lower quartiles. Statistical comparisons between PBS vs scAAV9‐hGALT‐treated GALT‐null pups in each age group were performed as described in Materials and Methods; groups with n < 3 were not assessed. Comparisons of GALT activity in scAAV9‐hGALT‐treated GALT‐null rats between time points yielded the following P values: for liver 8 to 14 days (P < .001), 14 to 30 days (P < .001), 30 to 60 days (P = .002); for brain 8 to 14 days (P = .525), 14 to 30 days (P = .328), and 30 to 60 days (P = .052). Panel C shows the relationship between GALT activity detected in liver and brain samples from the same animals described in panels A and B, with 8‐day‐old rats represented by white circles, 14‐day‐old rats represented by gray circles, 30‐day‐old rats represented by black circles, and 60‐day‐old rats represented by white triangles. *r 2 as presented is confounded by the inclusion of multiple time points because restored GALT activity is lost from liver and brain at different rates
