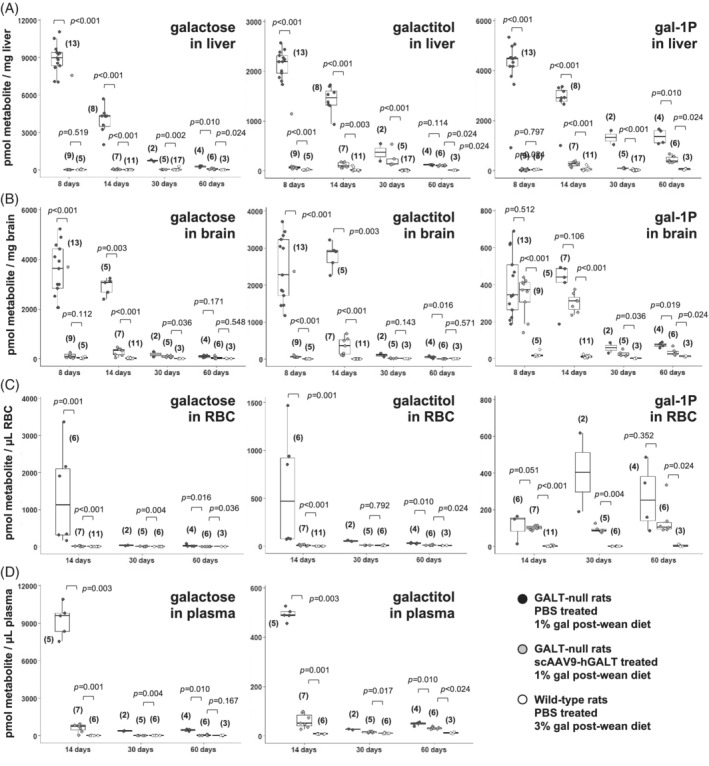
FIGURE 2.

Metabolites quantified over time in tissues from treated and control rats. Box and whisker plots show galactose, galactitol, and gal‐1‐P levels measured in samples of liver (panel A), brain (panel B), red blood cells (RBC, panel C), and plasma (panel D) collected from treated and control rats of the indicated ages. The top and bottom of each box represent the 75th and 25th percentiles, respectively, the middle line in each box represents the median for that set, and the whiskers, if any, represent the maximum and minimum values in the data set within 1.5 interquartile range (IQR) of the upper and lower quartiles. In all graphs, PBS‐treated GALT‐null rats are represented by black symbols, scAAV9‐hGALT‐treated GALT‐null rats by gray symbols, and PBS‐treated wild‐type rats by white symbols
