
Extended Data Fig. 5: Inhibiting ODC1 impedes the proliferation of human cancer cells with active YAP/TAZ.
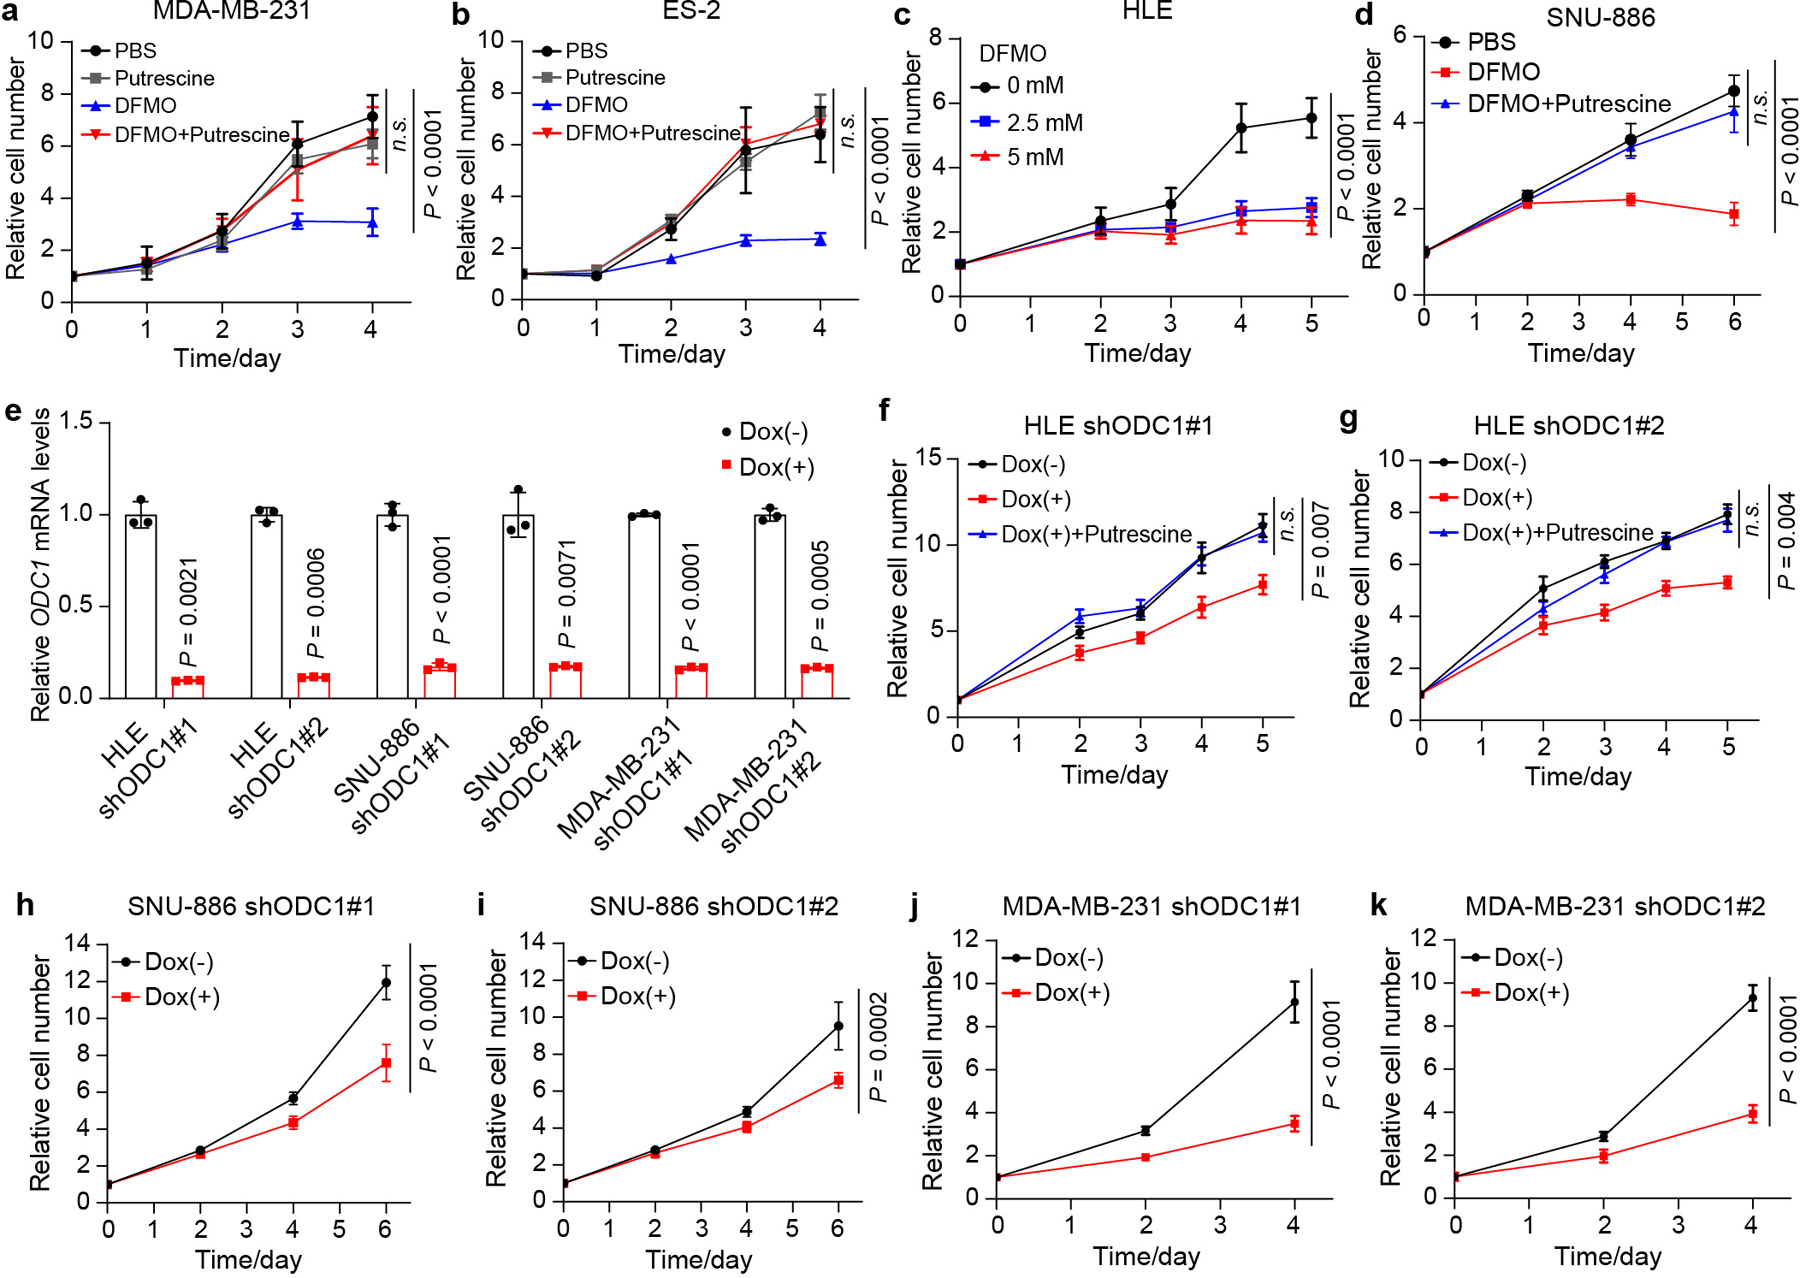
a,b, MDA-MB-231 and ES-2 cells were treated with PBS, 2.5 mM DFMO (ODC1 inhibitor), 1 mM putrescine or 2.5 mM DFMO plus 1 mM putrescine. Relative cell number was measured. Data are represented as mean ± SD, n = 5, two-way ANOVA, n.s., not significant P = 0.57. c, HLE cells were treated with different concentrations of DFMO. Relative cell number was measured. Data are represented as mean ± SD, n = 5, two-way ANOVA. d, SNU-886 cells were treated with PBS, 2.5 mM DFMO, 2.5 mM DFMO plus 1 mM putrescine. Relative cell number was measured. Data are represented as mean ± SD, n = 6, two-way ANOVA, n.s., not significant P = 0.65. e, ODC1 knockdown efficiency was evaluated by RT-qPCR in HLE, SNU-886 and MDA-MB-231 cells two days post dox treatment. Each cell line was tested with two different doxycycline (Dox) inducible shRNAs (shODC1 #1 and shODC1 #2). Data are shown as mean ± SD, n = 3, unpaired two-tailed Student’s t-test. f,g, HLE cells carrying shODC1 #1 or shODC1 #2 were treated with 1 μg/mL of Dox or 1 μg/mL of Dox plus 1 mM of putrescine. Relative cell number was measured. Data are represented as mean ± SEM, n = 6, two-way ANOVA, n.s., not significant P = 0.75. h,i, SNU-886 cells carrying shODC1 #1 or shODC1 #2 were treated with 1 μg/mL of Dox. Relative cell number was measured. Data are represented as mean ± SD, n = 6, two-way ANOVA. j,k, MDA-MB-231 cells carrying shODC1 #1 or shODC1 #2 were treated with 1 μg/mL of Dox. Relative cell number was measured. Data are represented as mean ± SD, n = 6, two-way ANOVA.