
Extended Data Fig. 6: Identification of LSD1 as a target of eIF5AHyp.
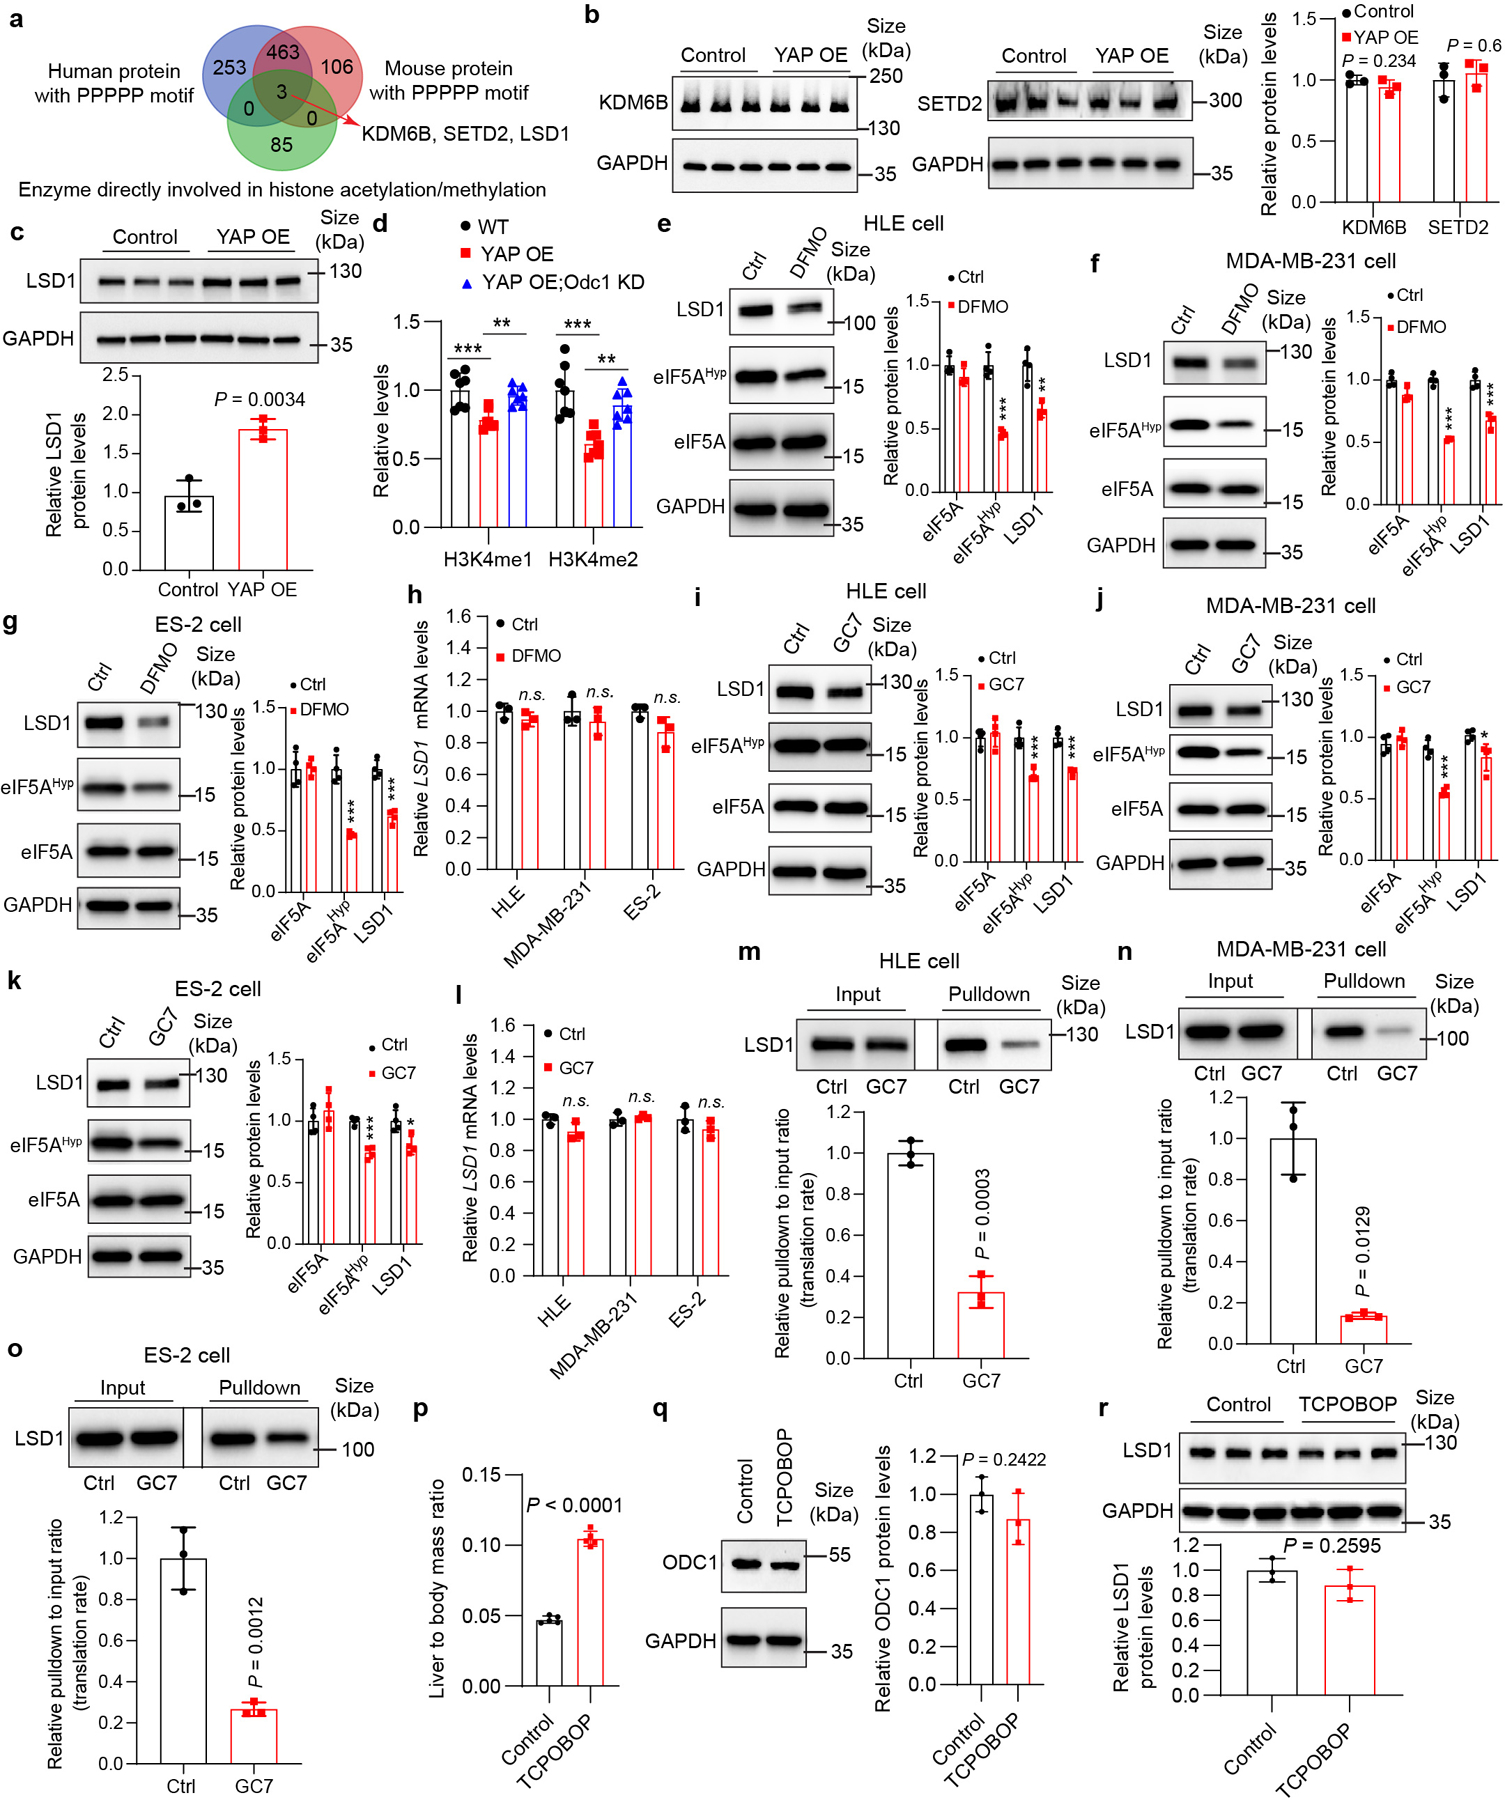
a, Whole proteome peptide sequence analysis identified 3 enzymes directly involved in histone acetylation and methylation with polyproline motif (≥ 5 consecutive proline residues) conserved in human and mouse. b, Relative KDM6B and SETD2 protein levels in control and YAP OE livers. Data are represented as mean ± SD, n = 3, unpaired two-tailed Student’s t-test. c, Relative LSD1 protein levels in control and YAP OE livers. Data are represented as mean ± SD, n = 3, unpaired two-tailed Student’s t-test. d, Relative levels of H3K4me1/2 in control, YAP OE and YAP OE;Odc1 KD livers. Data are represented as mean ± SD, n = 7, **P = 0.0046, ***P = 0.0009, one-way ANOVA with Dunnett’s multiple comparisons test. e-g, HLE, MDA-MB-231 and ES-2 cells were treated with 2.5 mM DFMO or PBS (Ctrl) for 72 hours. Relative eIF5AHyp and LSD1 levels were examined by western blot. Data are represented as mean ± SD, n = 4, **P = 0.0019, ***P = 0.00031, unpaired two-tailed Student’s t-test. h, HLE, MDA-MB-231 and ES-2 cells were treated with 2.5 mM DFMO or PBS (Ctrl) for 72 hours. Relative LSD1 mRNA levels were examined by RT-qPCR. Data are represented as mean ± SD, n = 3, n.s., not significant P = 0.0955, unpaired two-tailed Student’s t-test. i-k, HLE, MDA-MB-231 and ES-2 cells were treated with 10 μM GC7 or PBS (Ctrl) for 24 hours. Relative eIF5AHyp and LSD1 levels were examined by western blot. Data are represented as mean ± SD, n = 4, *P = 0.0223, ***P = 0.0008, **unpaired two-tailed Student’s t-test. l, HLE, MDA-MB-231 and ES-2 cells were treated with 10 μM GC7 or PBS (Ctrl) for 24 hours. Relative LSD1 mRNA levels were measured by RT-qPCR. Data are represented as mean ± SD, n = 3, n.s., not significant P = 0.112, unpaired two-tailed Student’s t-test. m-o, Western blots reveal newly synthesized LSD1 of HLE, MDA-MB-231 and ES-2 cells treated with GC7 or PBS (Ctrl) for 24 hours using the method shown in Fig. 4f. Data are represented as mean ± SD, n = 3, unpaired two-tailed Student’s t-test. p-r, Mice were treated with vehicle (Control) and a single dose of 3 mg/kg TCPOBOP prepared in 10% DMSO/90% corn oil (TCPOBOP). Liver size (p), ODC1 protein levels (q) and LSD1 protein levels (r) were examined 7 days post TCPOBOP treatment. Data are represented as mean ± SD, n = 5 for p, n = 3 for q and r, unpaired two-tailed Student’s t-test.