
Fig. 2|. YAP/TAZ regulates ODC1 expression and polyamine biosynthesis in human HCC.
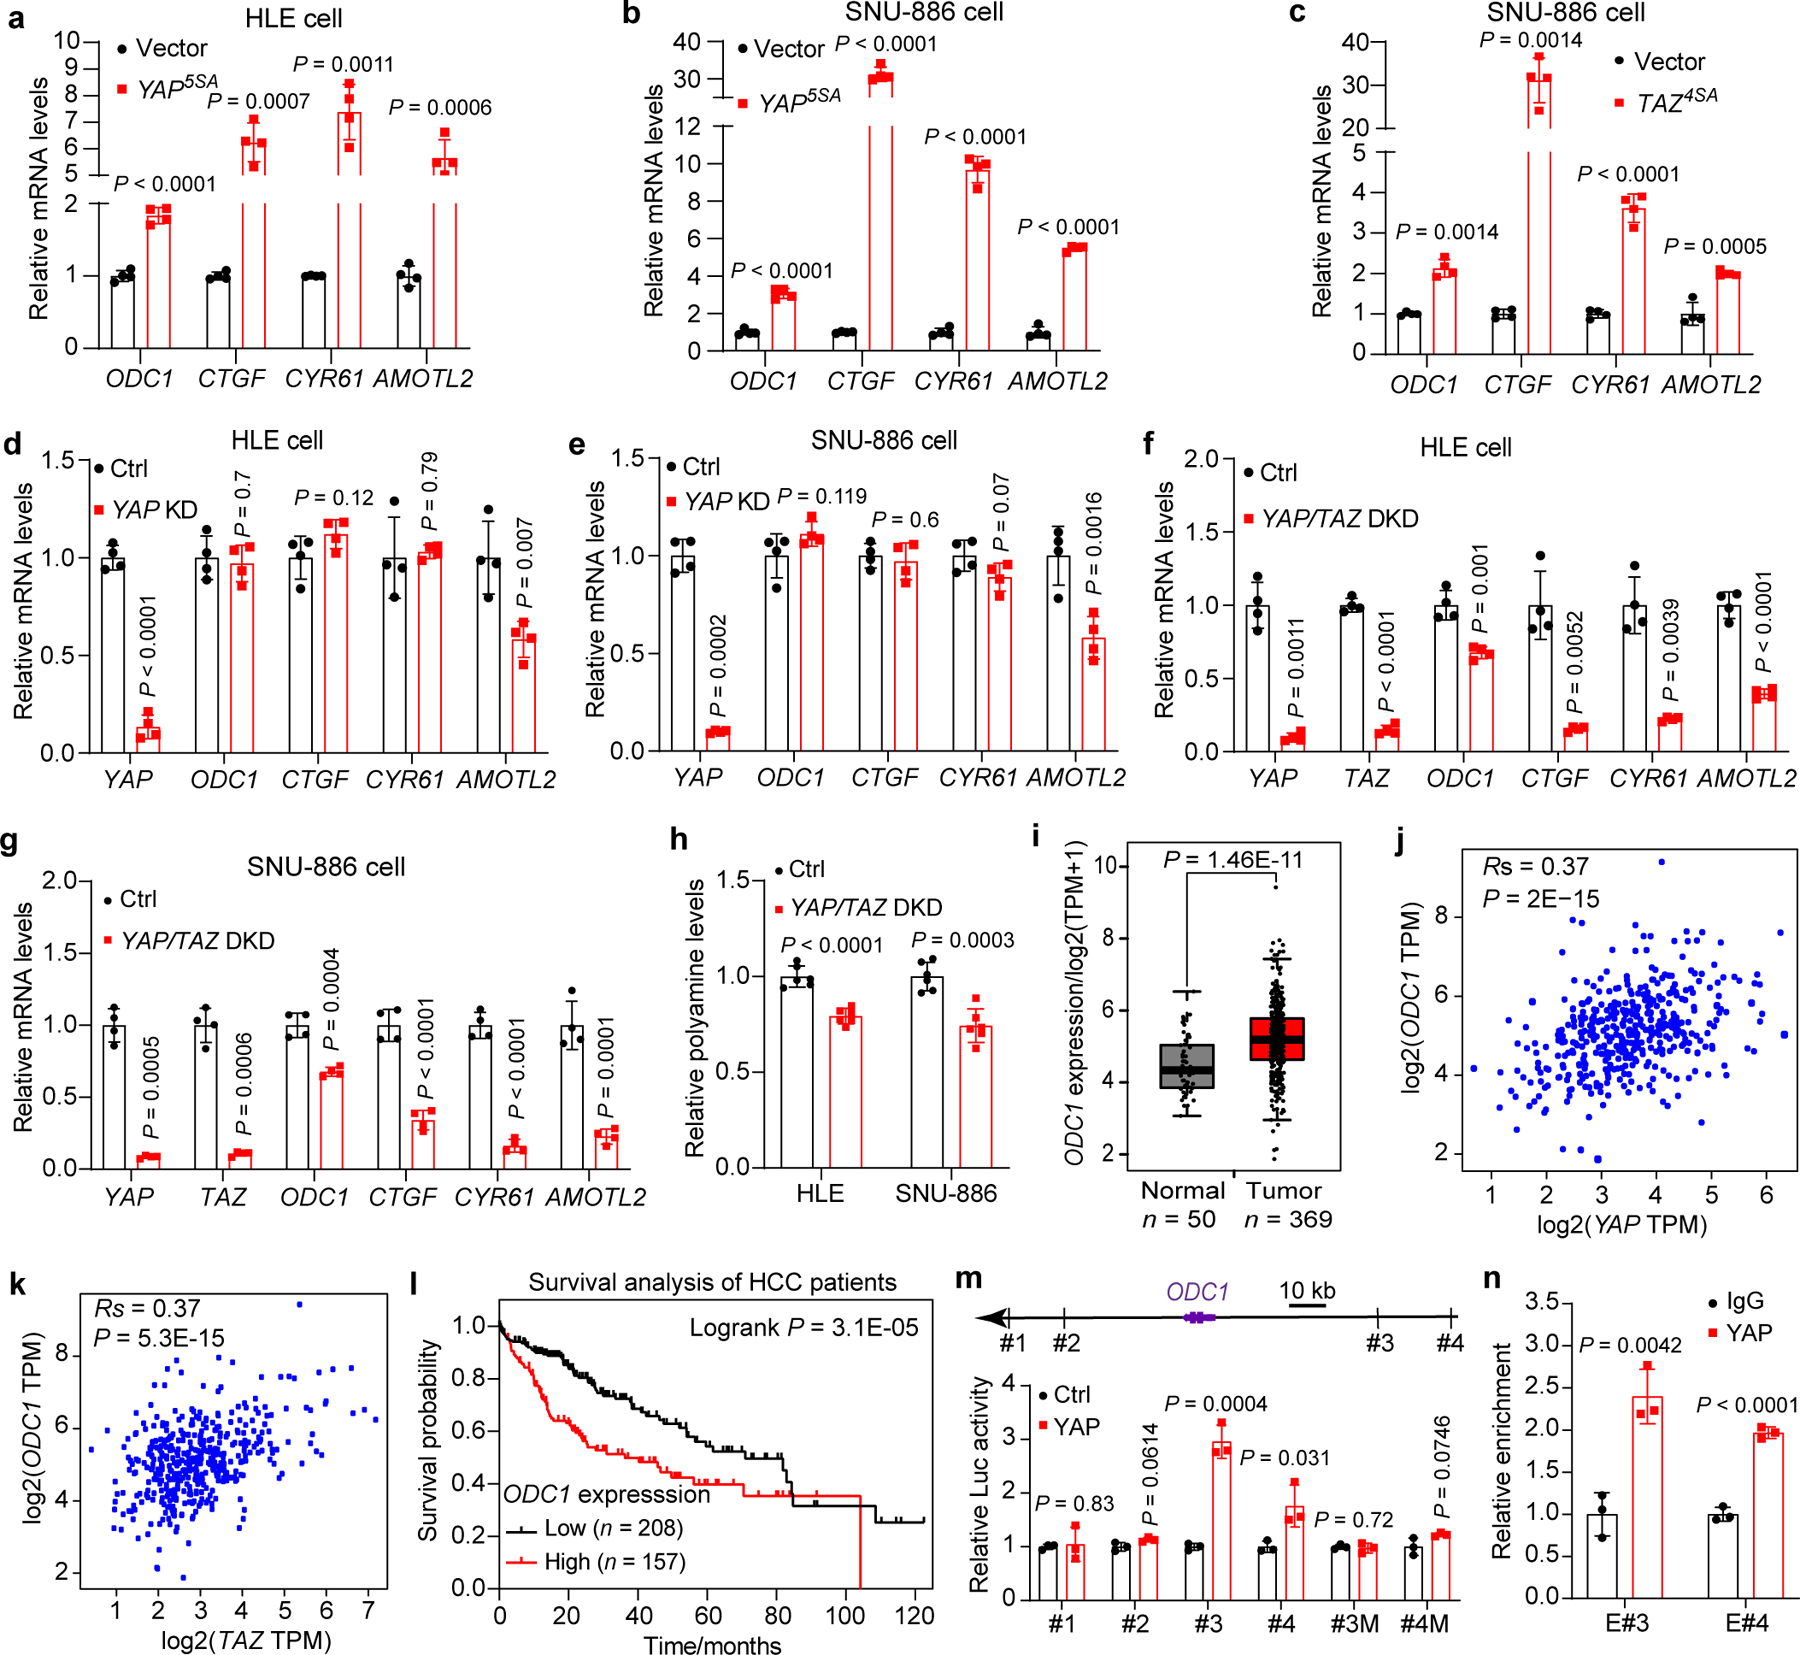
a,b, HLE and SNU-886 cells were transfected with Lenti-vector (Vector) or Lenti-YAP5SA (YAP5SA) to establish stable cell lines, and relative mRNA levels of indicated genes were measured by RT-qPCR. Data are represented as mean ± SD, n = 4, unpaired two-tailed Student’s t-test.
c, SNU-886 cells were transiently transfected with empty vector or TAZ4SA plasmids, and relative mRNA levels of ODC1 were measured by RT-qPCR. Data are represented as mean ± SD, n = 4, unpaired two-tailed Student’s t-test.
d,e, HLE and SNU-886 cells were transfected with siRNA targeting YAP (YAP KD) or non-targeting control (Ctrl). Relative mRNA levels of indicated genes were measured by RT-qPCR. Data are represented as mean ± SD, n = 4, unpaired two-tailed Student’s t-test.
f,g, HLE and SNU-886 cells were transfected with siRNAs targeting YAP and TAZ (YAP/TAZ DKD) or non-targeting control (Ctrl). Relative mRNA levels of indicated genes were measured by RT-qPCR. Data are represented as mean ± SD, n = 4, unpaired two-tailed Student’s t-test.
h, Relative total polyamine levels were measured in the indicated cells. Data are represented as mean ± SD, n = 6, unpaired two-tailed Student’s t-test.
i, Comparison of ODC1 mRNA levels (TPM, transcripts per million) in tumors and matched normal tissues from human hepatocellular carcinoma (HCC) patients in the TCGA dataset. For the boxplots, the center lines mark the median, the box limits indicate the 25th and 75th percentiles, and the whiskers extend 1.5× the interquartile range from the 25th and 75th percentiles (biologically independent samples n = 50 for normal, n = 369 for tumor, unpaired two-tailed Student’s t-test).
j,k, Spearman correlation between YAP/TAZ and ODC1 in tumors and matched normal tissues from HCC patients in the TCGA dataset (two-tailed Spearman’s correlation test).
l, Kaplan-Meier overall survival analysis of ODC1 for HCC patients from the TCGA dataset. P value was calculated using the two-side log-rank test.
m, Luciferase reporter assay in 293T cells of putative ODC1 enhancers containing either wildtype or mutated TEAD binding sites. Data are represented as mean ± SD, n = 3, unpaired two-tailed Student’s t-test.
n, ChIP-qPCR assay in SNU-886 cells showing YAP bound to ODC1 enhancer #3 and #4. Data are represented as mean ± SD, n = 3, unpaired two-tailed Student’s t-test.