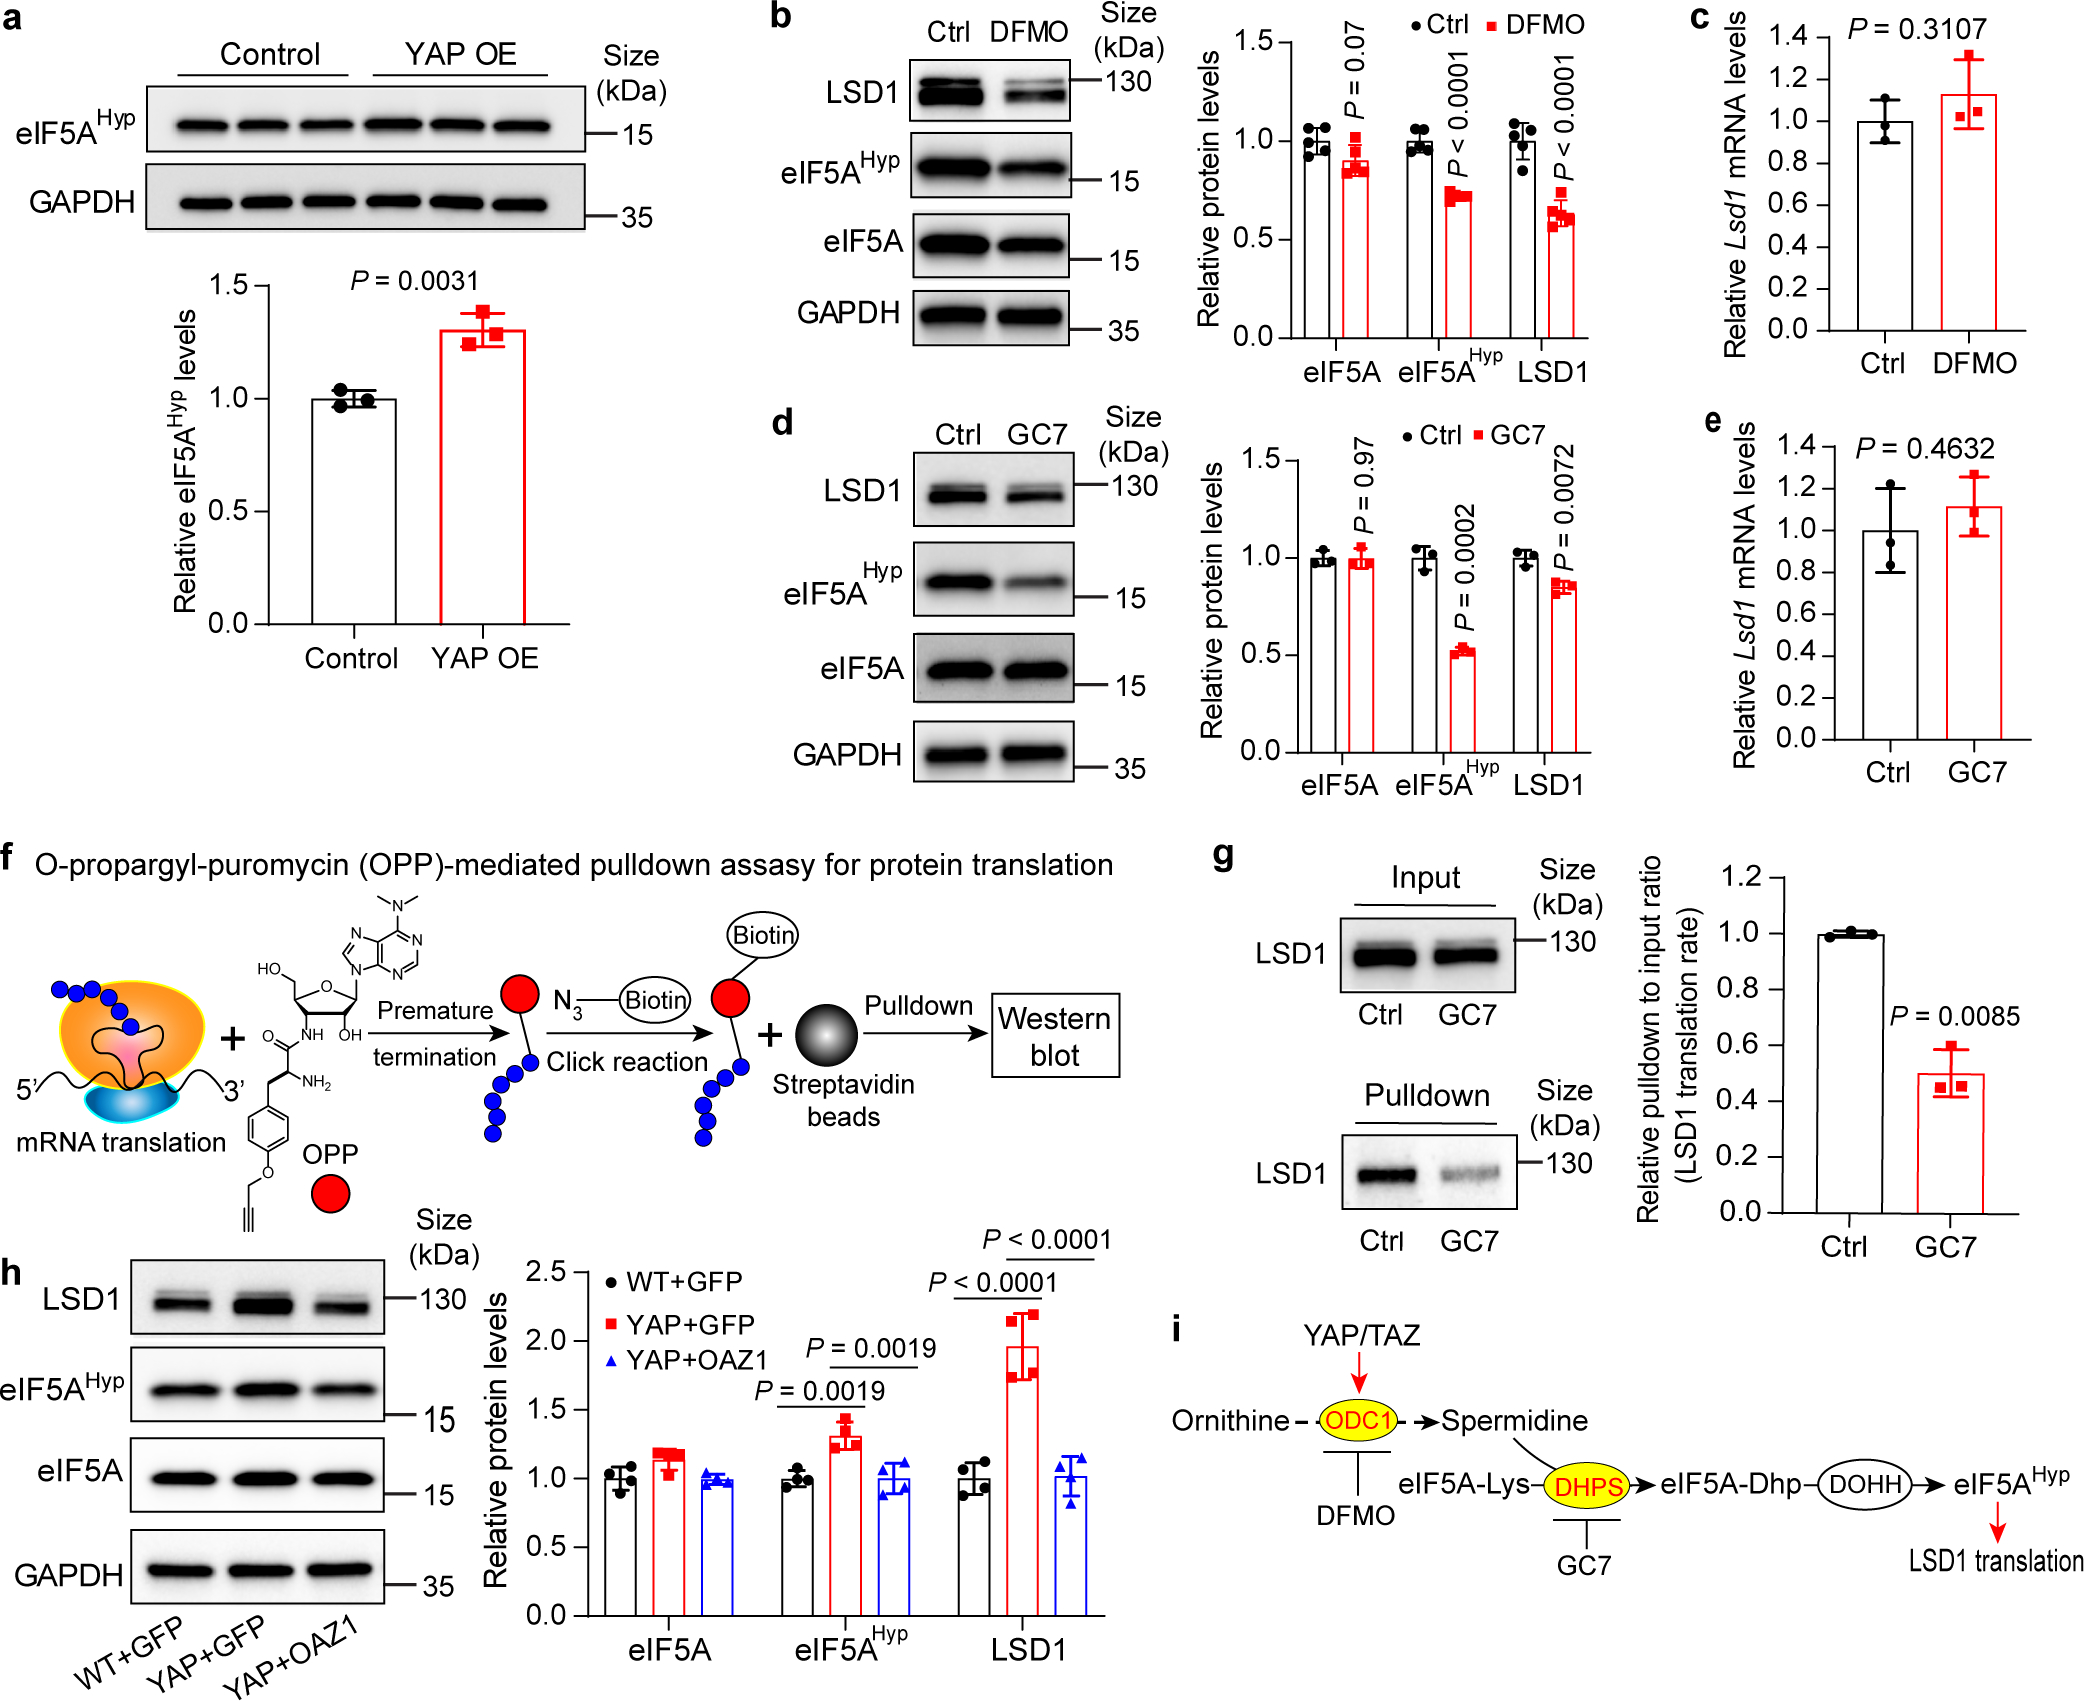
Fig. 4|. Polyamine-mediated eIF5A hypusination (eIF5AHyp) is required for efficient translation of LSD1.

a, Relative levels of eIF5AHyp in control and YAP OE mouse livers. Data are represented as mean ± SD, n = 3, unpaired two-tailed Student’s t-test.
b,c, AML12 cells were treated with 2.5 mM DFMO or PBS (Ctrl) for 72 hours. eIF5AHyp and LSD1 protein and Lsd1 mRNA levels were examined. Data are represented as mean ± SD, n = 5 for b, n = 3 for c, unpaired two-tailed Student’s t-test.
d,e, AML12 cells were treated with 10 μM GC7 or PBS (Ctrl) for 24 hours. eIF5AHyp and LSD1 protein and Lsd1 mRNA levels were examined. Data are represented as mean ± SD, n = 3, unpaired two-tailed Student’s t-test.
f, OPP-pulldown assay for nascent protein synthesis. OPP is incorporated into newly translated proteins, then the azide group on biotin is conjugated to an alkyne group on OPP by click reaction. Biotin-labeled proteins are pulldown by magnetic streptavidin beads and detected by western blot.
g, Relative levels of newly synthesized LSD1 of AML12 cells treated with 10 μM GC7 or PBS (Ctrl) for 24 hours using the method shown in panel (f). Data are represented as mean ± SD, n = 3, unpaired two-tailed Student’s t-test.
h, Relative protein levels of LSD1, eIF5A and eIF5AHyp in livers of wild type mice treated with AAV8-GFP (WT+GFP), YAP OE treated with AAV8-GFP (YAP+GFP) or AAV8-Oaz1 (YAP+OAZ1) (see Extended Data Fig. 4a,b for experimental design). Quantification data are represented as mean ± SD, n = 4, one-way ANOVA, Dunnett’s multiple comparisons test.
i, A schematic showing the proposed polyamine-eIF5AHyp-LSD1 axis.
