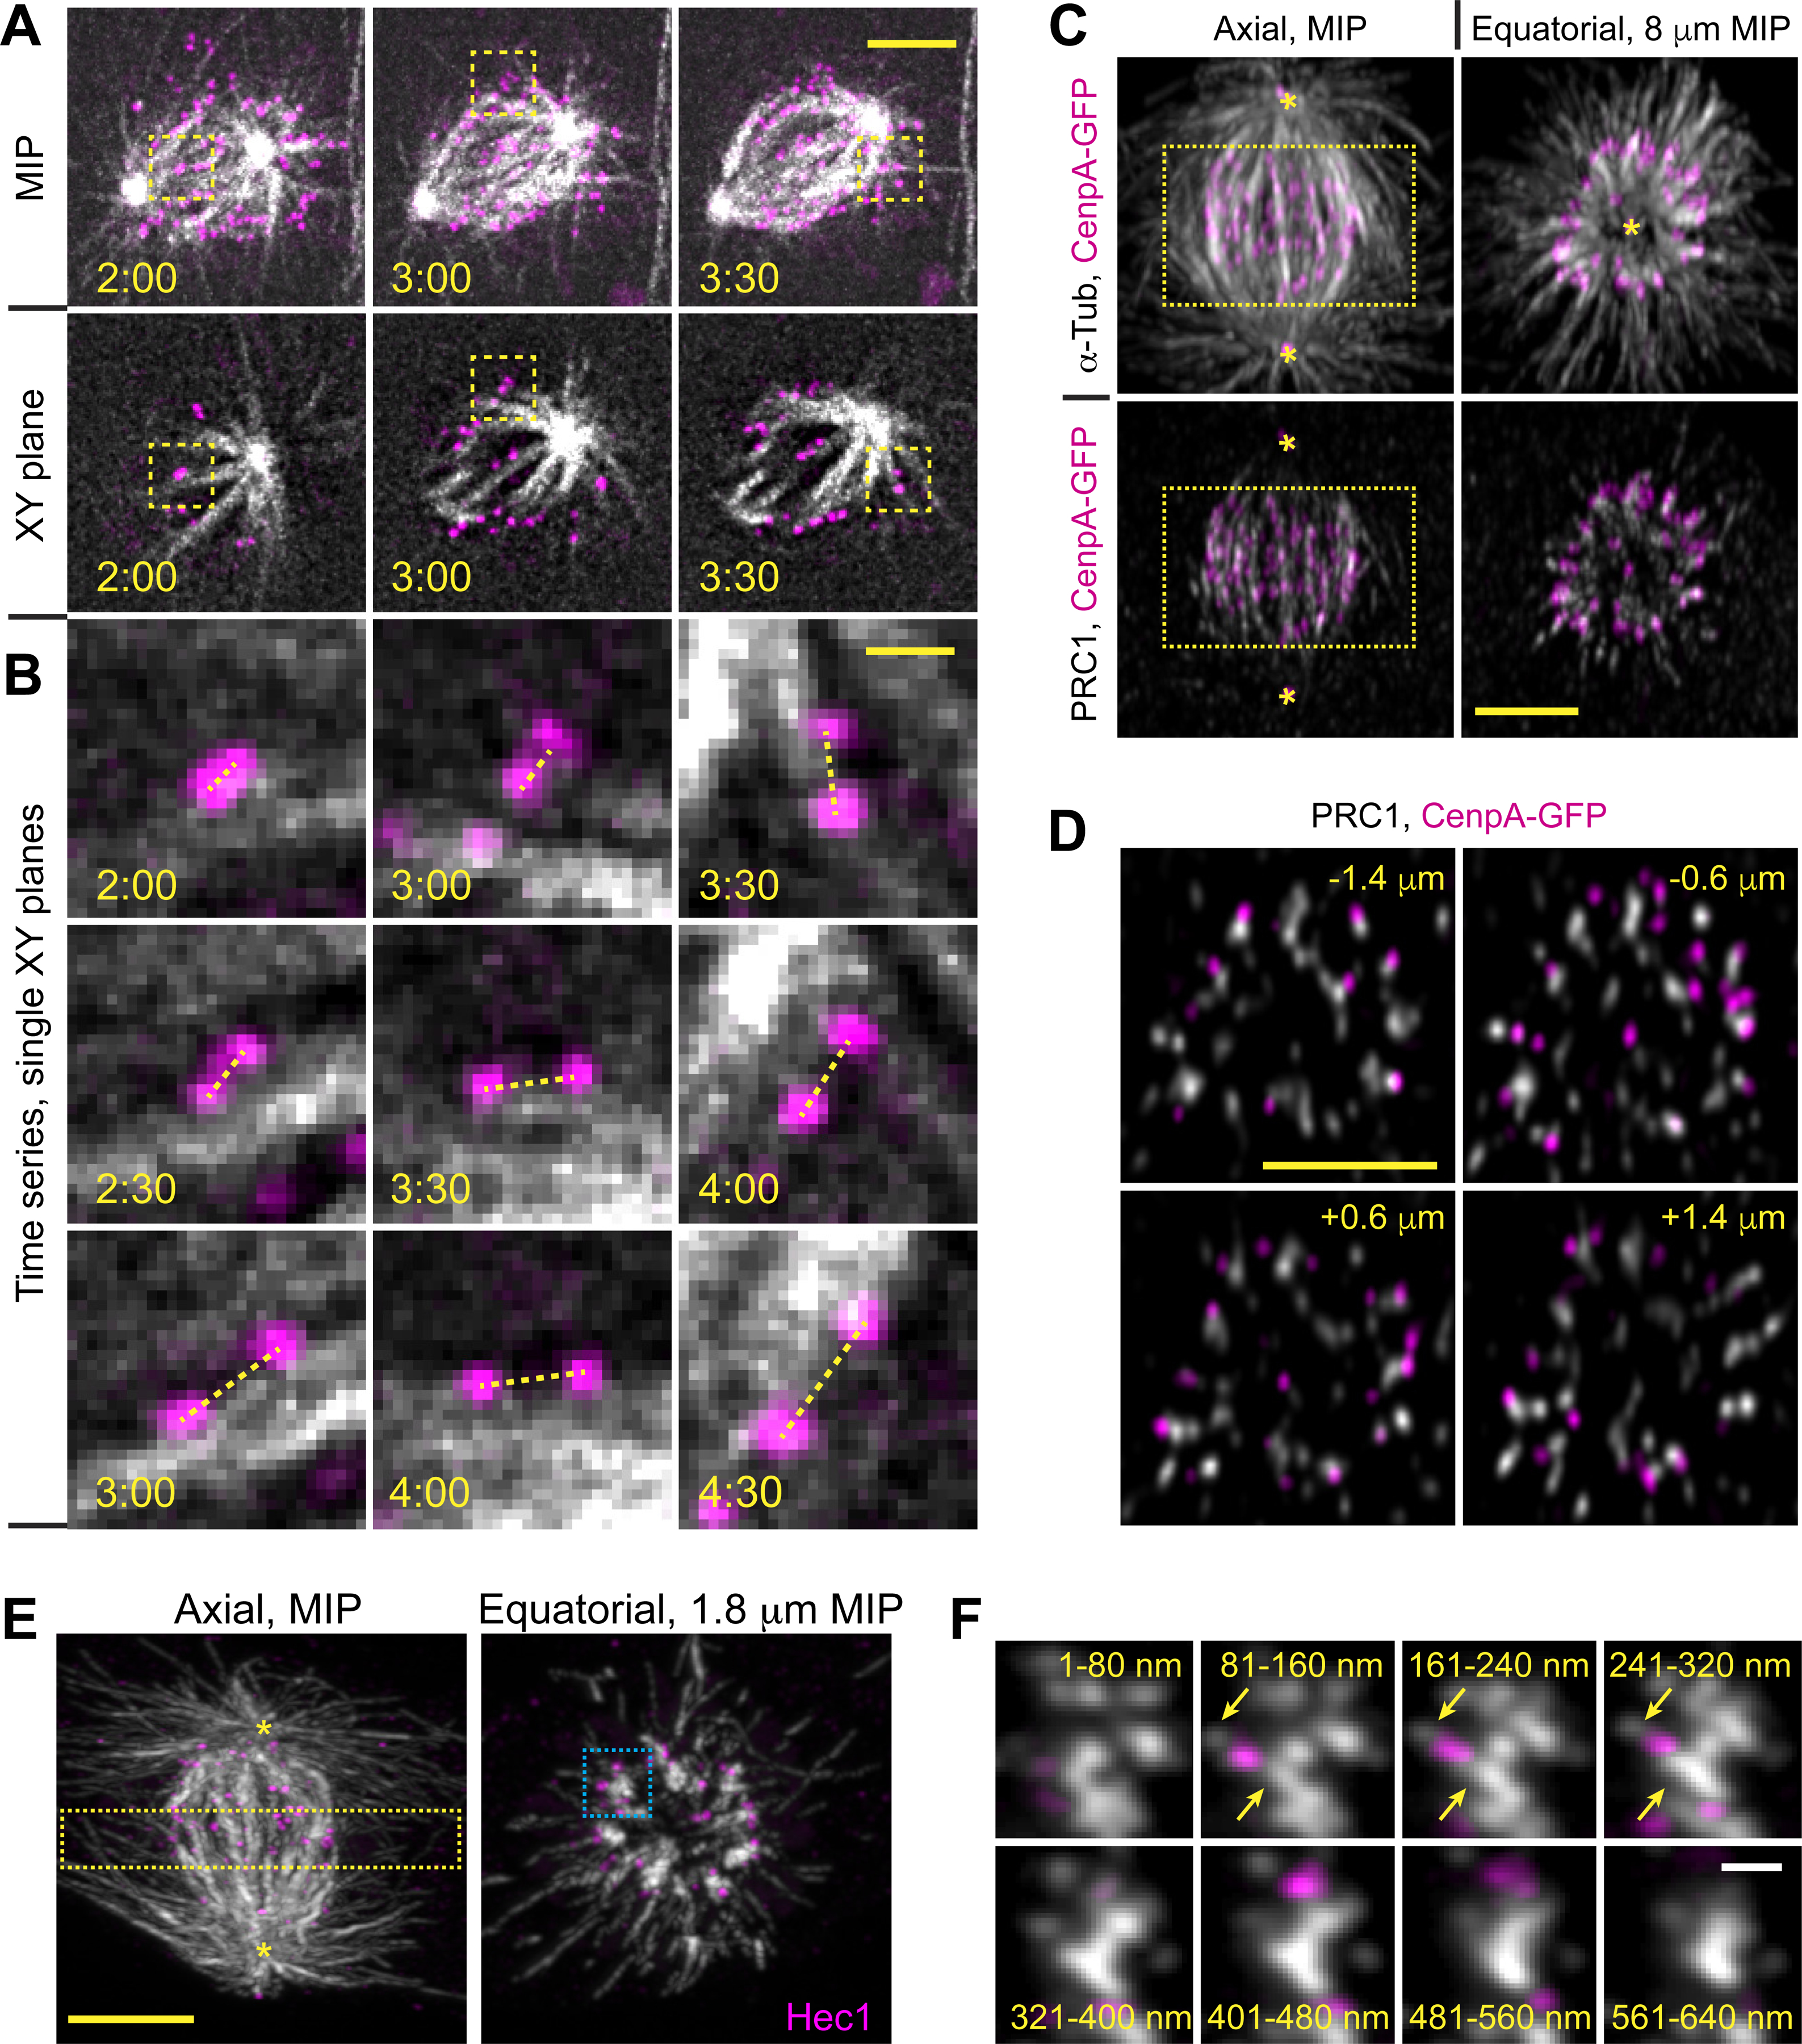
Figure 2. Amphitelic attachments form near microtubule bundles.

(A) Selected timepoints from a recording of RPE1 cell with GFP-tagged KTs and centrioles (shown in magenta) and SiR-Tubulin-labeled MTs (shown in grayscale). Maximum-intensity projections (top row) and selected single planes (bottom row) are shown for each timepoint. (B) Biorientation behavior of three KTs marked with boxes in (A). Notice that centromeres abruptly orient parallel to a MT bundle and stretch within 1 min after the initial contact with this bundle. (C) Spatial arrangement of MTs (α-Tubulin), MT bundles (PRC1), KTs (CenpA-GFP), and centrioles (Ctn1-GFP) in a prometaphase cell with ~12-μm long spindle. Axial view is a maximum-intensity projection of the entire spindle. Equatorial view presents a partial volume denoted by the box in Axial view. Asterisks denote centrioles. (D) Individual equatorial planes from the volume shown in (C). Distance from each plane to the spindle equator is shown. (E) Similar to (C) but this volume is constructed from a series of 80-nm sections (array tomography) and KTs are visualized via immunostaining for Hec1. (F) Sequential tomography slices detailing MT distribution near KTs marked with the blue box in (E). Arrows denote α-Tubulin spots between KTs and MT bundles. Scale bars, 5 μm in (A), (C), (D) and (E), 1 μm in (B), and 0.5 μm in (F). Asterisks mark positions of spindle poles. See also Figure S2 and Video S2.
