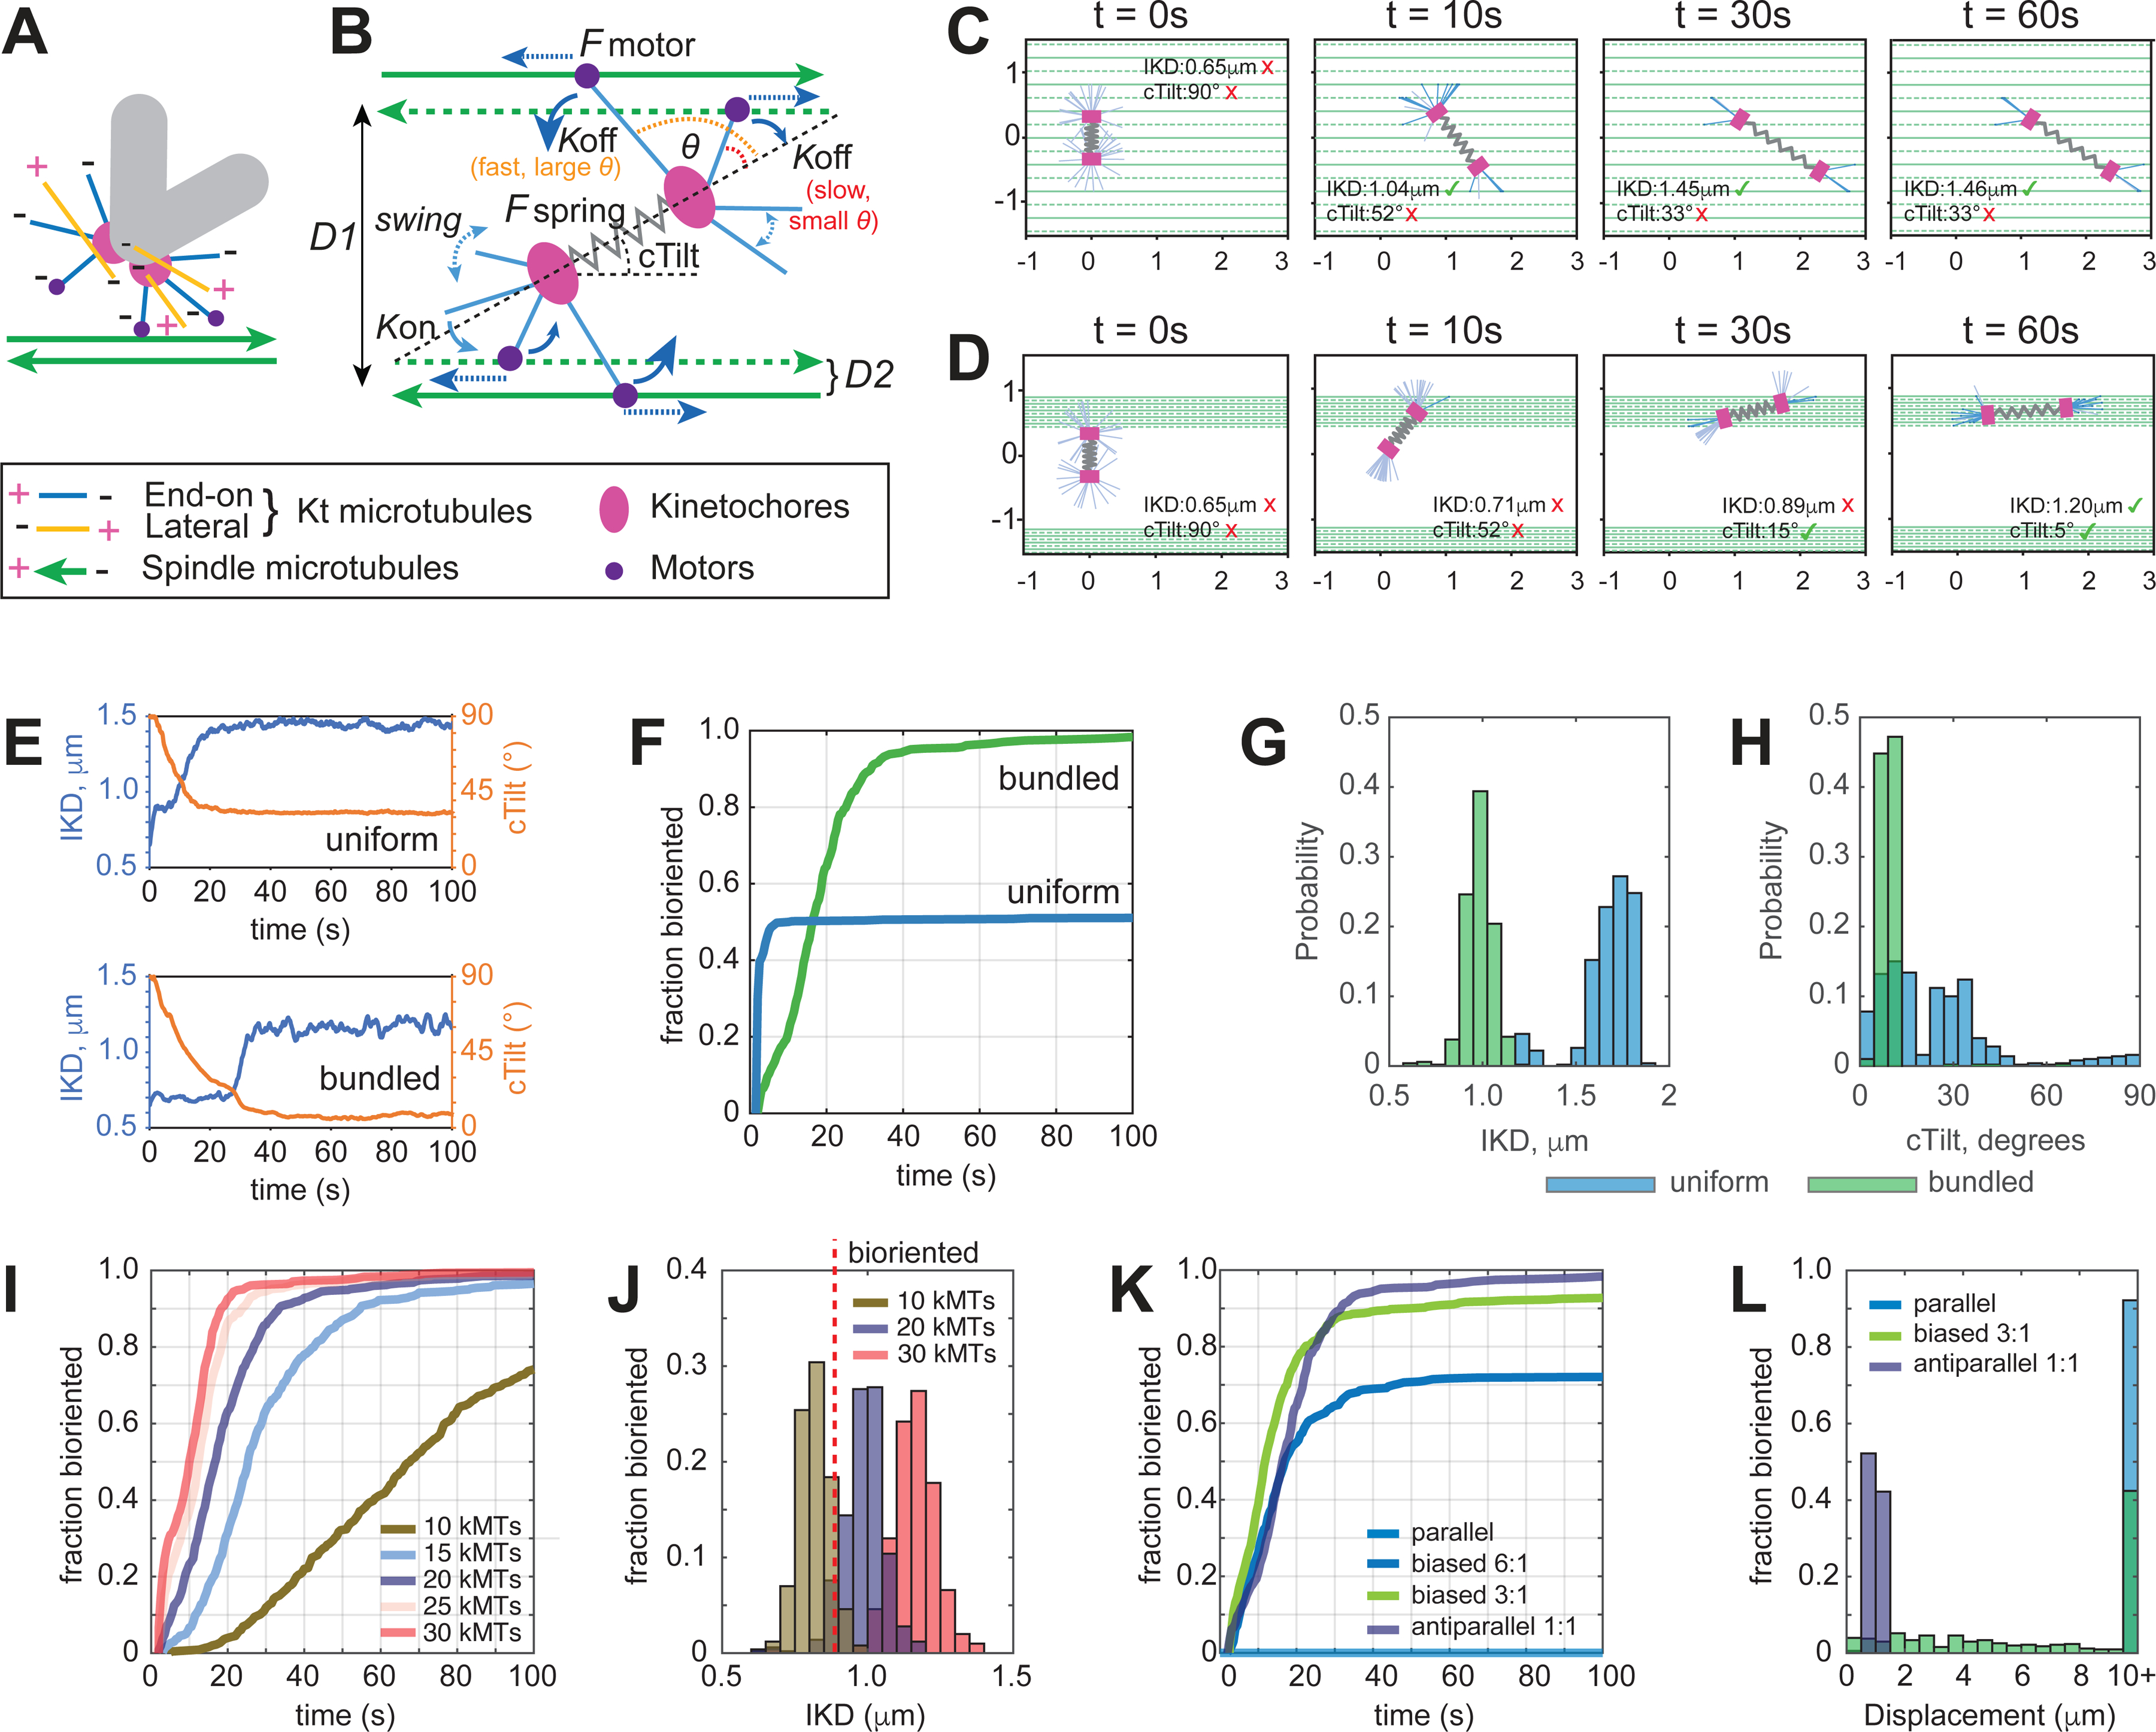
Figure 5. Computational model of chromosome biorientation.

(A) MT arrangement at the KTs considered in the model. Only MTs with the plus end attached to the KT and the minus end protruding outwards (blue lines) contribute to the interaction with the spindle. This interaction is mediated by a minus end-directed motor (dynein, purple dots). (B) Principal framework of the model. Protruding KT MTs pivot around the KTs until their minus ends connect to the walls of reachable spindle MTs with rate defined by Kon when in proximity. Once connected, the minus end attempts to move along the spindle MT towards its minus end. Connections of MTs protruding from sister KTs to spindle MTs of opposite polarity stretches the centromere and increases longevity of the connection by decreasing the rate Koff via their spatial organization. Orientation of the spindle MTs is intermittent, and their organization is characterized by the distances D1 and D2. See Supplemental Text for details. (C-E) Examples of behavior predicted for centromeres (single simulation run). (C) On spindle surface comprising evenly spaced (D1=D2=200 nm distance) MTs of intermittent polarity, the centromere stretches but fails to orient along the spindle axis. (D) On spindle surface comprising MT bundles separated by D1=2 μm (10 MTs of intermittent polarity, D2=50 nm), the centromere orients and stretches to the level expected for bioriented chromosomes. (E) dynamics of IKD and cTilt for centromeres shown in (C) and (D). (F) Fraction of centromeres predicted to achieve biorientation at various times for the evaluated scenarios. (G,H) Predicted distributions of IKD and cTilt after 100 s of interaction with the spindle surface comprising evenly spaced individual MTs (blue) vs. MT bundles (green). (I) Fraction of bioriented centromeres for various numbers of MT minus ends protruding from the KT. (J) Distributions of IKD predicted for various numbers of MT minus ends after 100 s of interaction with MT bundles. (K) Fraction of bioriented centromeres for various ratios of MTs with the opposite polarity. Notice that biorientation fails on parallel MT bundles (light blue). (L) Predicted displacement from the point of initial contact towards the bundle terminus with the greater number of minus ends for bundles with various polarity bias (100 s of interaction, 20 MTs protruding from the kinetochore). See also Video S5.
