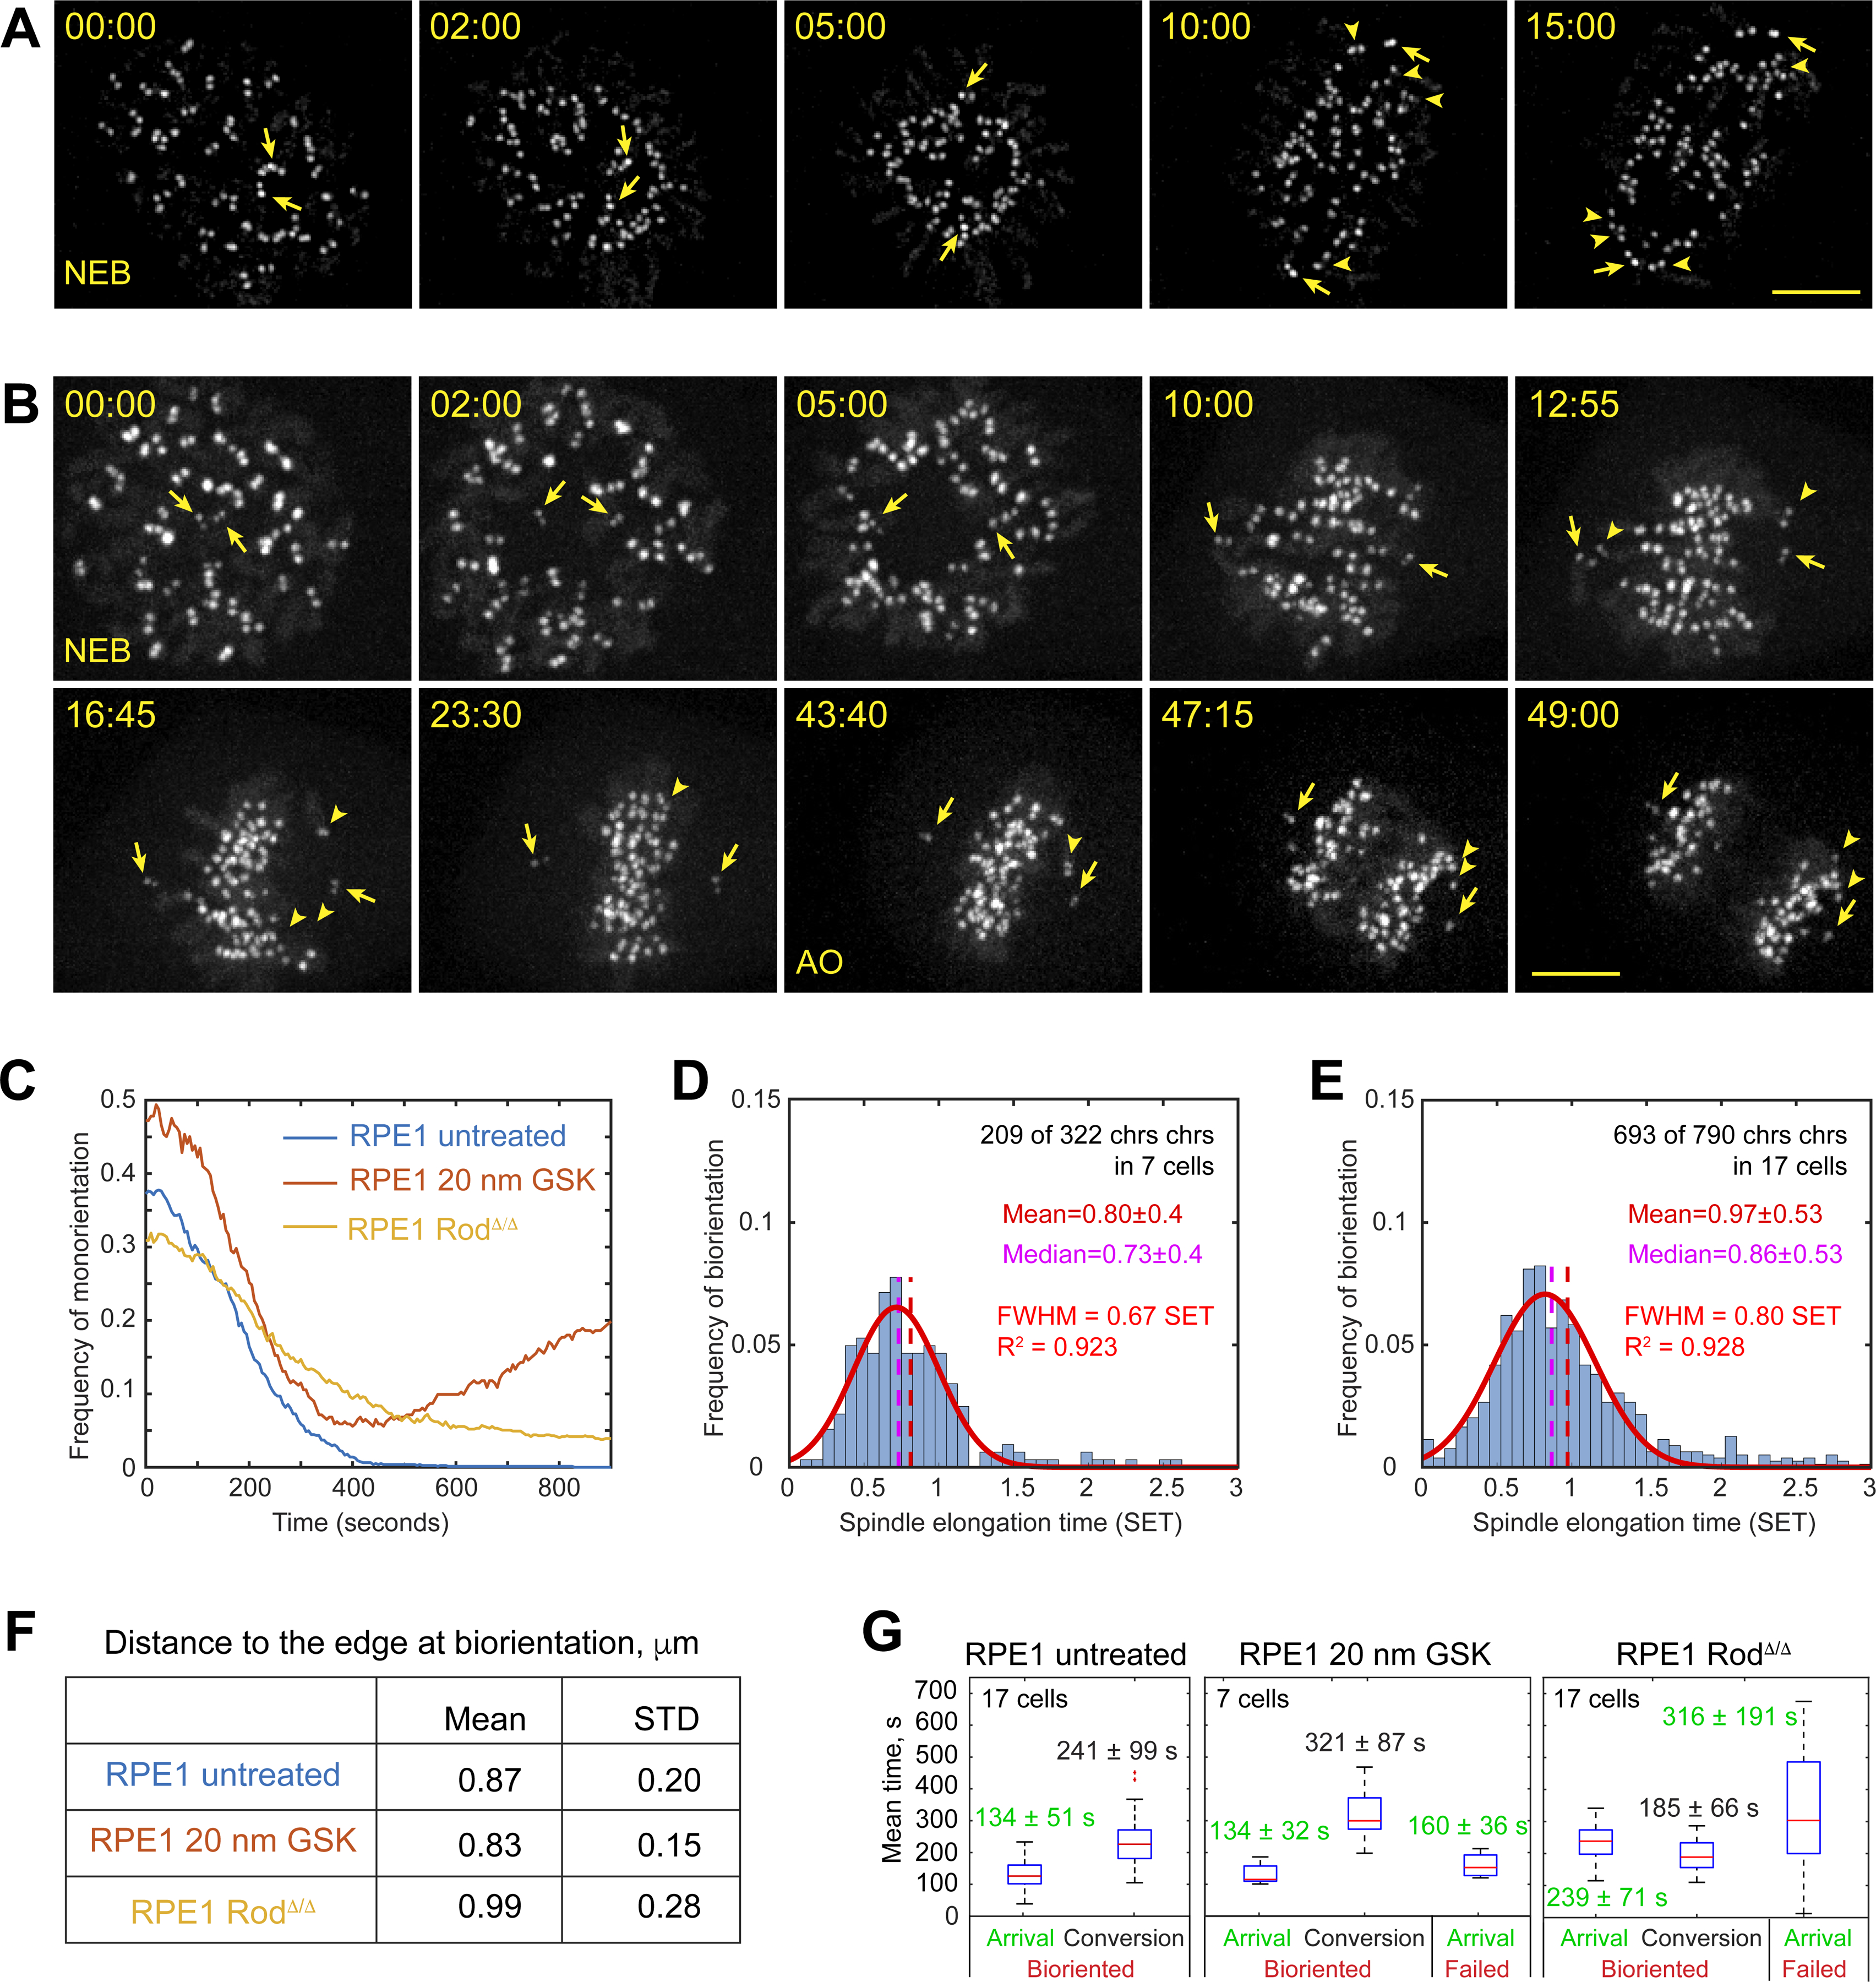
Figure 6. Dynamics and localization of amphitelic attachment formation in cells lacking activities of CenpE or dynein at the kinetochore.

(A,B) Selected timepoints from recording of mitosis in the wt RPE1 cell treated with 20-nM GSK923295 (A) or RPE1 RodΔ/Δ (B). KTs and centrioles are tagged with CenpA-GFP and Centrin1-GFP. Arrows denote centrioles. Arrowheads point at KTs on monooriented chromosomes. Scale bar, 5 μm. (C) Fraction of chromosomes with centromeres residing <0.25 of the spindle length from a pole (i.e., monooriented). (D,E) Temporal distribution of biorientation events (normalized by spindle elongation time) in cells lacking activity of CenpE (D) or dynein at the KT (E). (F) Mean and STD values for distances from centromeres to the edge of the bundle-enriched spindle domain during formation of amphitelic attachments. (G) Tuckey’s box plots for times when centromeres arrive within 0.85 μm from the edge of the bundle-enriched domain (Arrival) and intervals from the arrival to the formation of amphitelic attachments (Conversion). Arrival times of centromeres that formed amphitelic attachments and centromeres that fail to biorient in the first 15 min of prometaphase are reported separately. Mean values are reported with STD. See also Figure S4, Videos S6 and S7.
