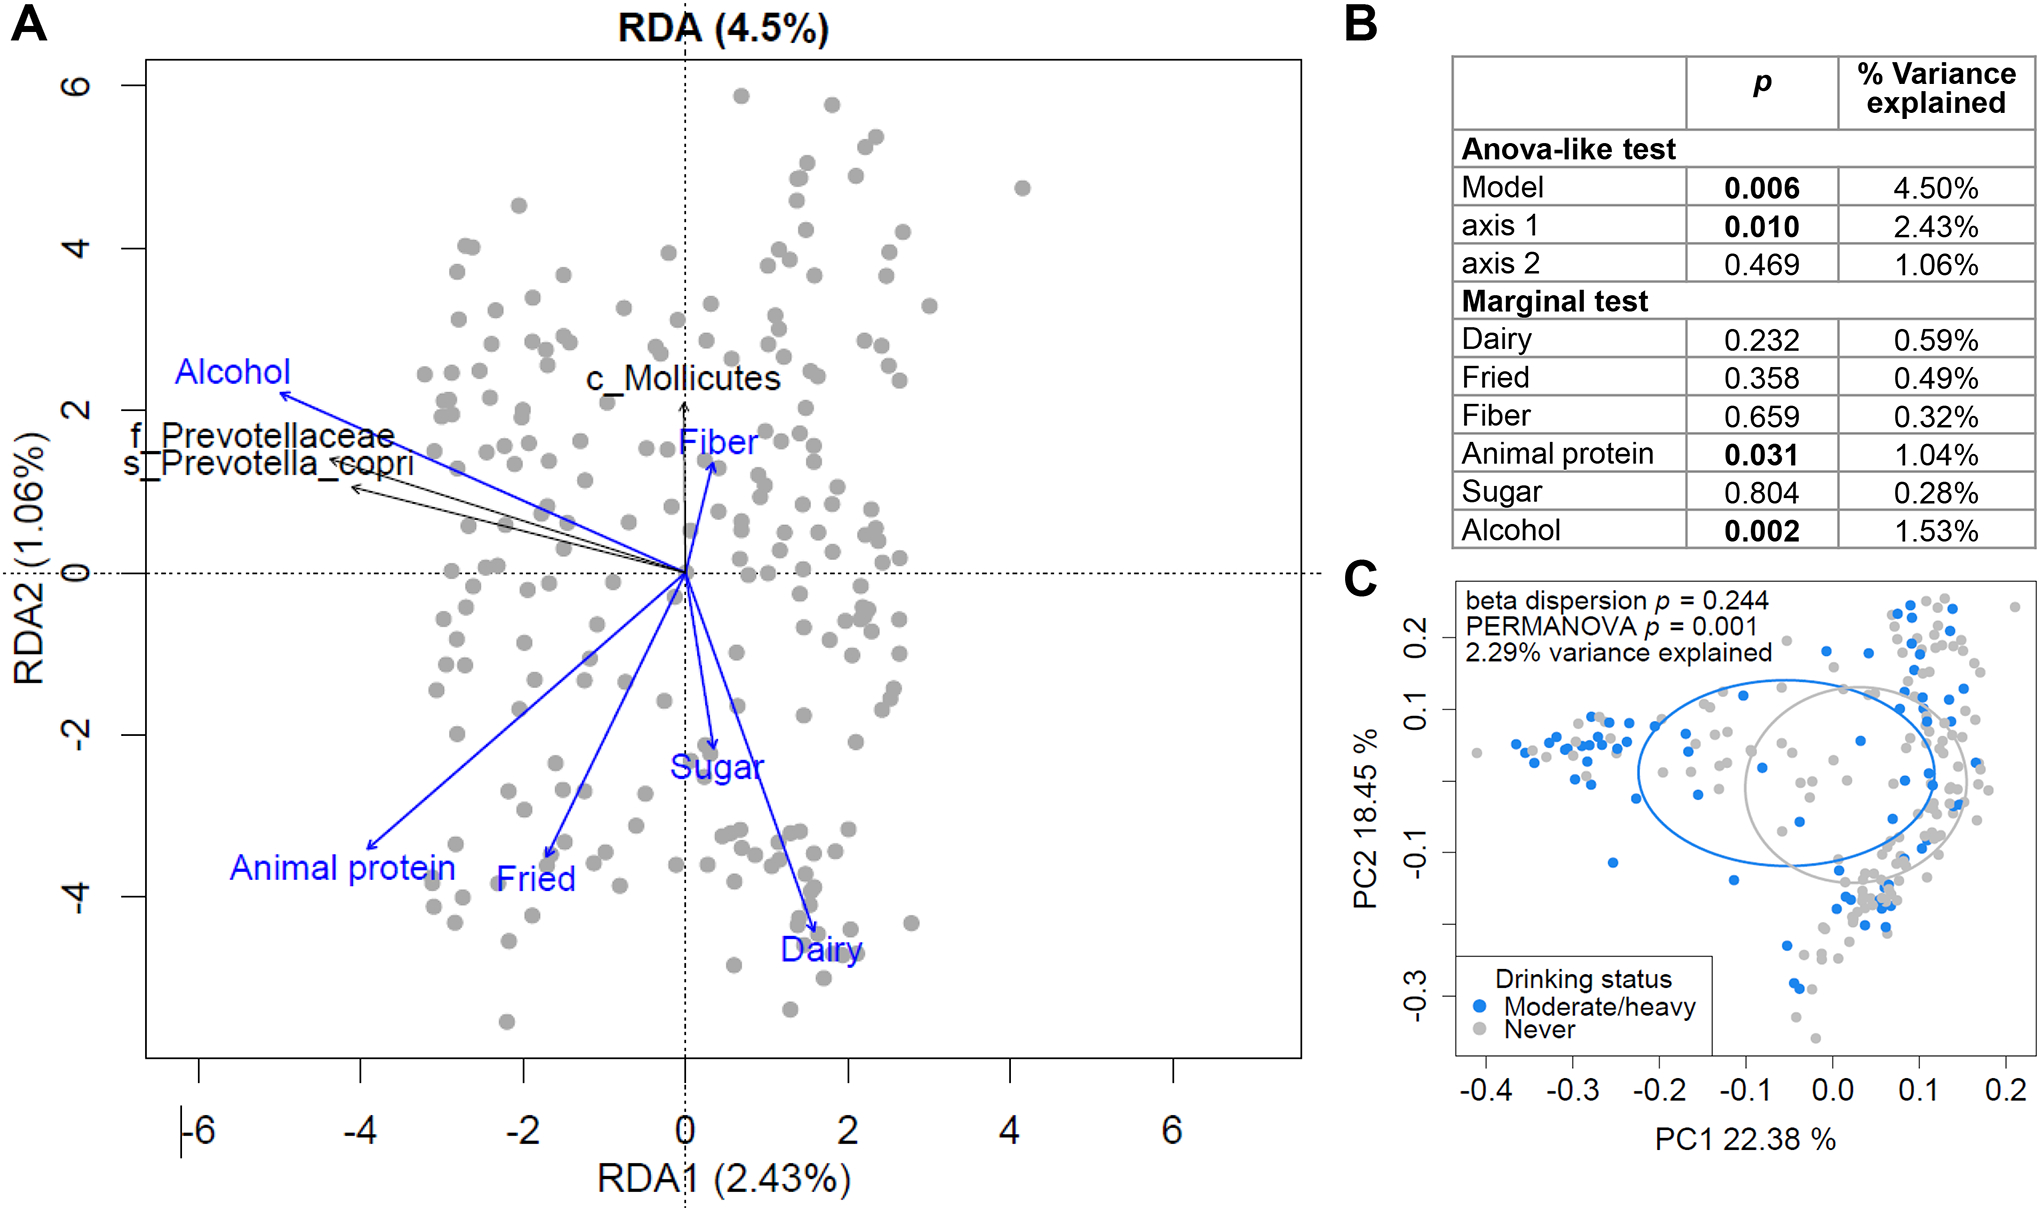
Fig. 4.

Dietary factors affecting liver fibrosis-associated microbiome profiles. (A-B) RDA to evaluate the relationship between dietary intake and the abundance profiles of taxa significantly associated with liver fibrosis. (A) Triplots of redundancy analysis. Explanatory variables (dietary groups) are shown in blue. Abundance of liver fibrosis-associated bacteria are shown in black as response variables and overlaid using the envfit function in the R vegan package on the linear constraints. Only taxa significant by envfit permutation test (p<0.05) are shown. Classifications at the class (c_), family (f_) and species (s_) levels are shown. (B) ANOVA-like significance test of the RDA model, axes and explanatory variables. (C) PCoA plot of overall gut microbiome profiles, based on weighted UniFrac distances, with samples grouped by drinking status.
