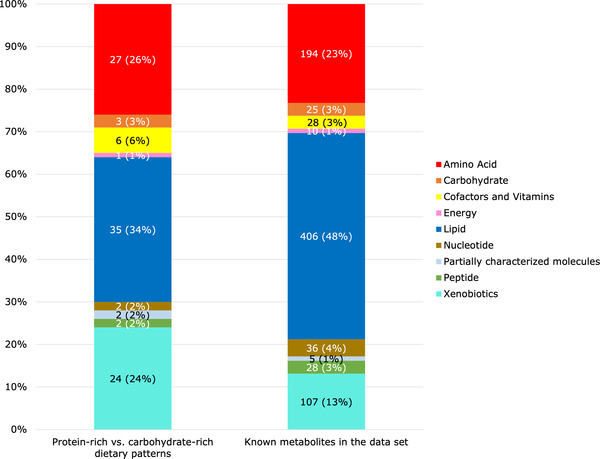
Figure 1.

Metabolite categories (n (%)) significantly associated with the protein‐rich dietary pattern relative to the carbohydrate‐rich dietary pattern in the OmniHeart trial. “Known metabolites in the data set” indicates the distribution of all 839 plasma metabolites detected in the OmniHeart trial participants. For example, out of 102 metabolites which differed significantly between the protein‐rich versus carbohydrate‐rich dietary patterns, 24 (24%) metabolites were xenobiotics. Out of 839 known metabolites in the data set, 107 (13%) metabolites were xenobiotics. Considering the distribution of metabolite categories in the data set, xenobiotics (24% vs 13%) and amino acids (26% vs 23%) were overrepresented when we compared the protein‐rich versus carbohydrate‐rich dietary patterns.
