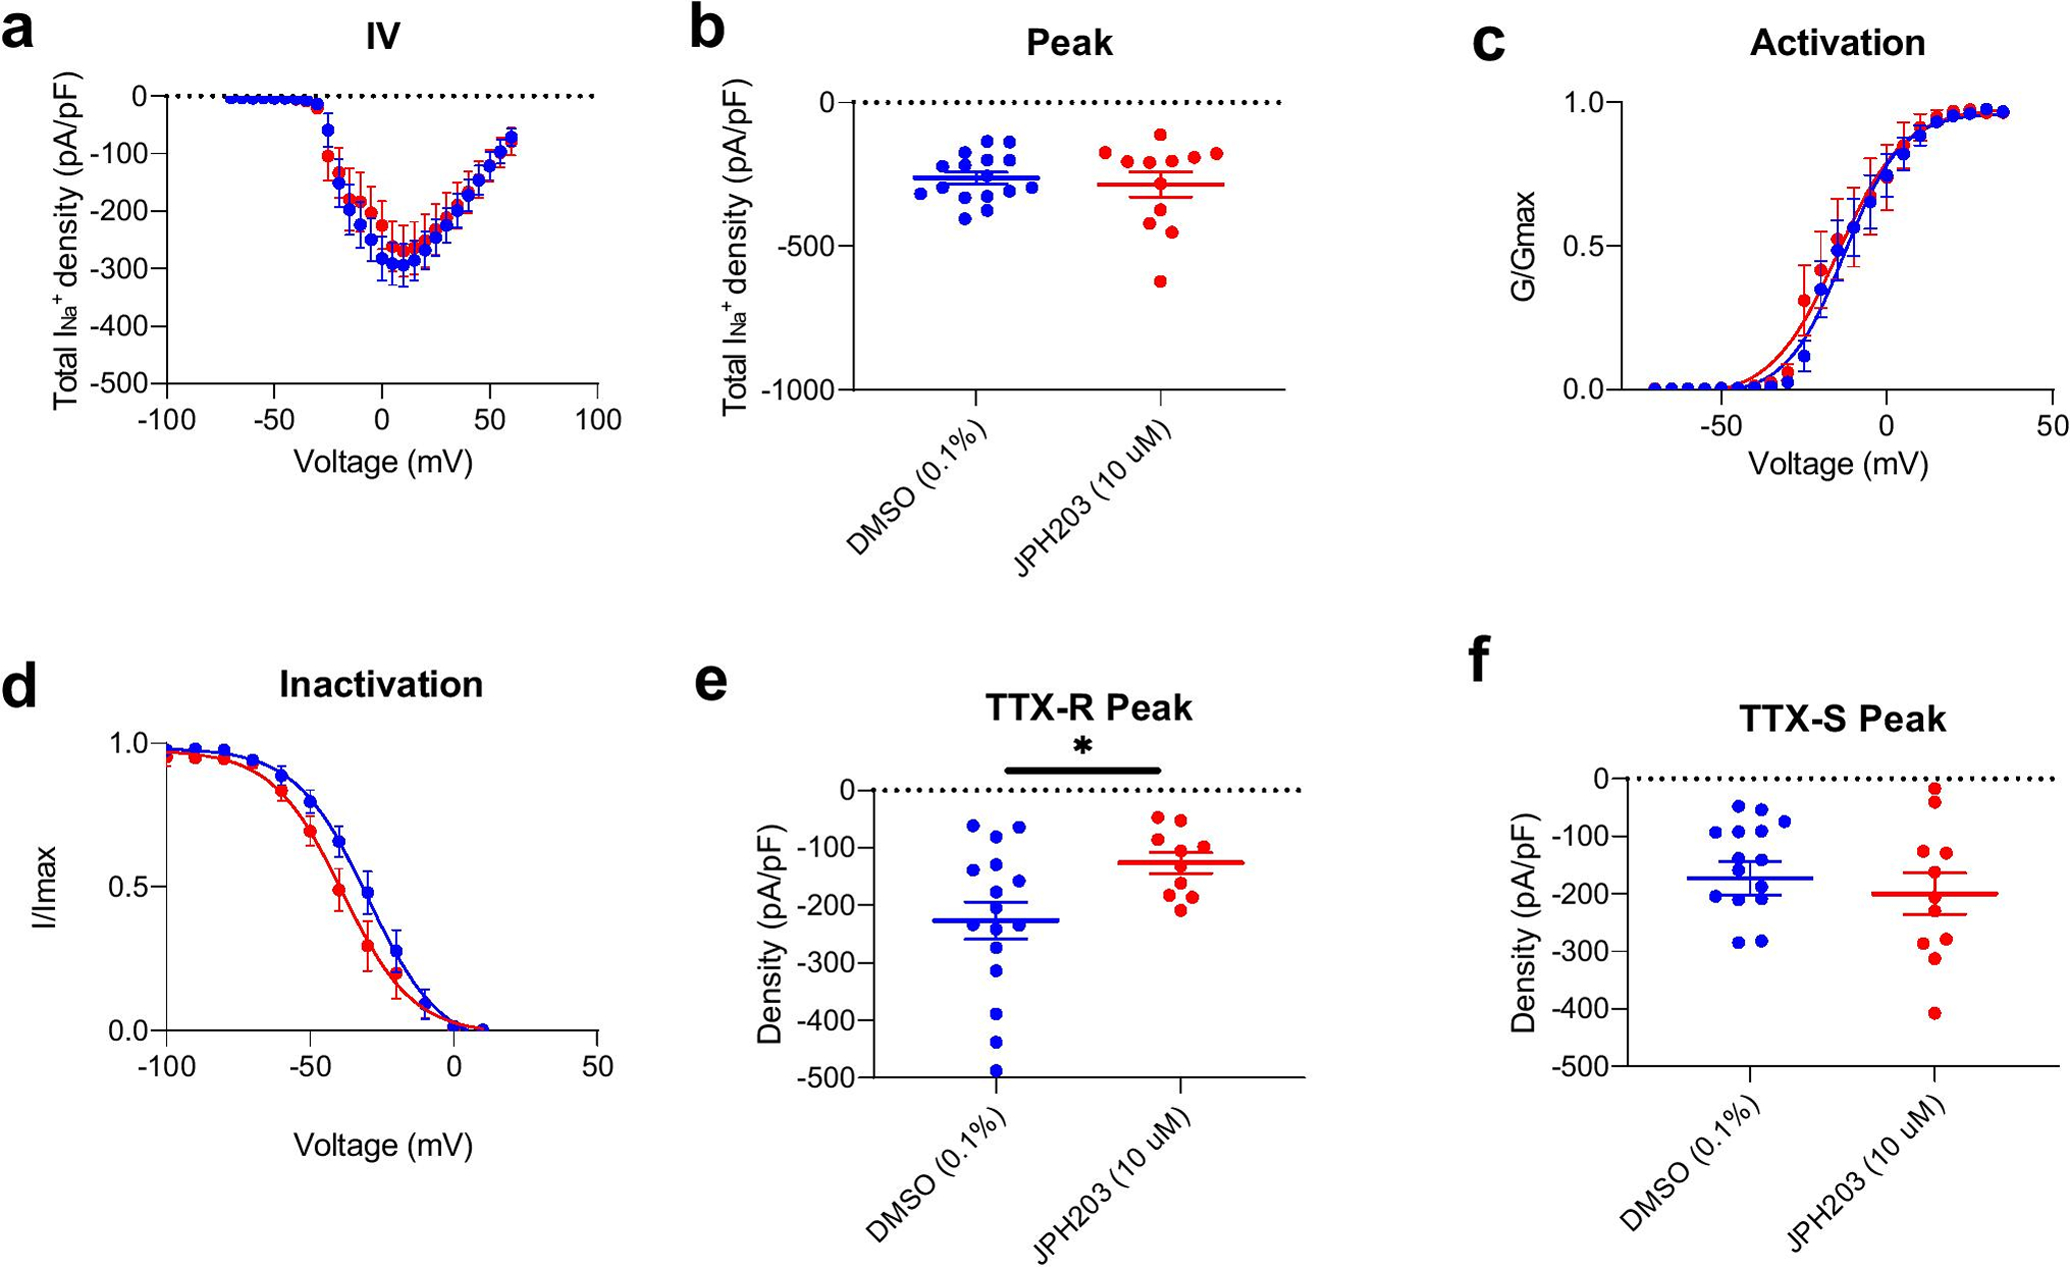
Figure 4. Effect of Slc7a5 blockade on Na+ currents recorded from rat DRG neurons.

a. Total Na+ current density. b. Peak INa (Control: −262 ± 20.4 mV, JPH203: −285 ± 43.3 mV) c. Activation and d. Inactivation plots for INa. e. TTX-resistant (TTX-R) peak (Control: −227 ± 32.2 mV, JPH203: −126 ± 18.1 mV), but not f. TTX-sensitive (TTX-S) Na+ current peak (Control: −173 ± 28.8 mV, JPH203: −200 ± 35.8 mV) was significantly reduced following JPH203 treatment (n=11–16 cells, *p<0.05, Student’s t-test). Results of activation and inactivation curve fitting are shown in Table 1.
