Figure 2.
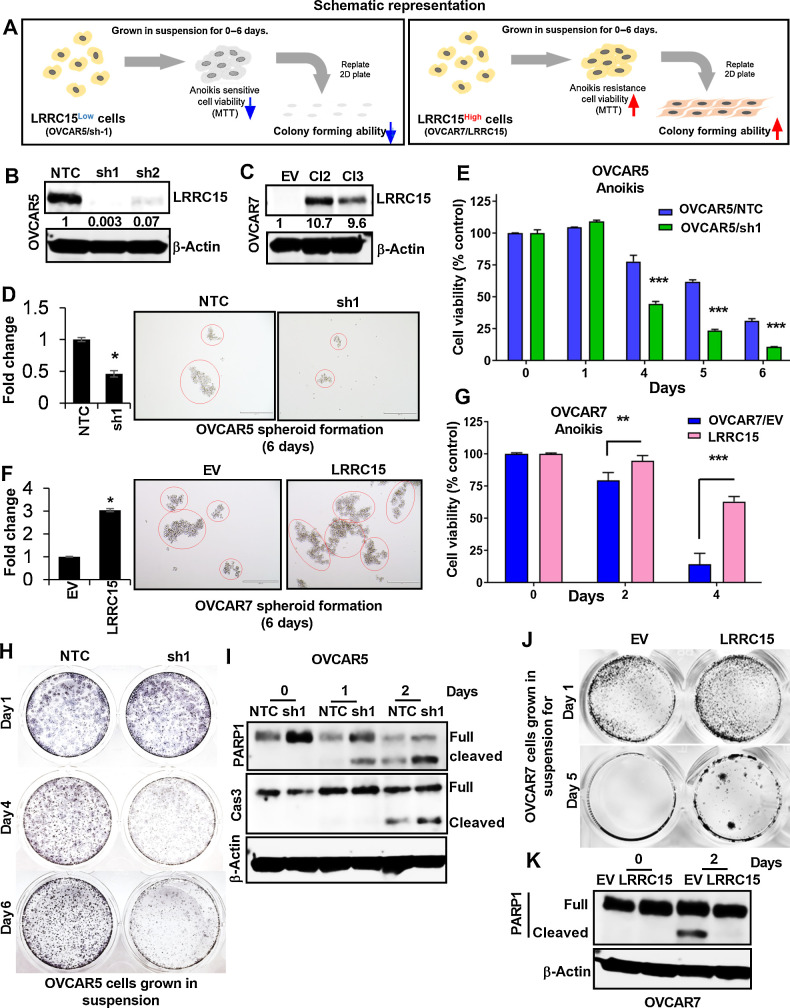
LRRC15 renders cells resistant to anoikis. A, Schematic representation of the experimental protocol. B and C, Immunoblot analysis of LRRC15 expression in OVCAR5 NTC and sh1/sh2 KD cells (B) and in the OVCAR7 EV-transfected control cells and Cl2 and Cl3 LRRC15 OE cells (C). β-Actin was used as a loading control. Fold change was calculated using the Image J software, normalized to endogenous control, and provided beneath the panel. D, 3D-spheroid formation assay was performed for 6 days in OVCAR5 NTC control and LRRC15 sh1 KD cells. Quantification as fold change was provided. E, OVCAR5 NTC and sh1 cells spheroids were subsequently transferred into adhesive plates for the indicated time points, followed by MTT assay. The percent cell viability was scored and plotted. Results show the mean ± SEM. F, Spheroid formation assay was performed in OVCAR7 EV control and LRRC15 OE cells and is represented as fold change. G, Cell viability assay was performed in the mentioned cells for the indicated time points in similar manner. The percent cell viability was plotted with the mean ± SEM. H, Colony-forming assay was performed with OVCAR5 NTC and sh1 spheroid culture transferred in 6-well adhesive plates and imaged upon staining with Coomassie blue for the mentioned time points. I, Immunoblot analysis of cleaved PARP1 and cleaved caspase-3 levels was performed under similar conditions for days 0 to 2. J and K, Colony-forming assay and Western blot analysis for cleaved PARP1 was performed in the OVCAR7 EV and LRRC15 overexpressed cells in a similar manner. β-actin used as loading control. **, P < 0.01; ***, P < 0.001.

