. 2022 Mar 15;82(6):1038–1054. doi: 10.1158/0008-5472.CAN-21-0622

Figure 3.

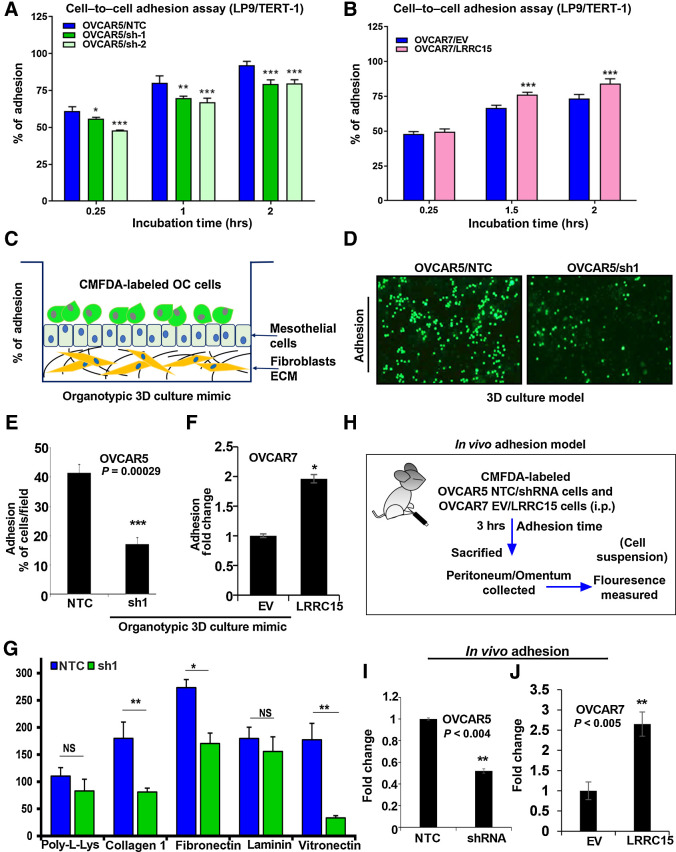
Figure 3. LRRC15 KD abrogates the adhesion phenomenon in the OC cells. A and B, OVCAR5 NTC, sh1/sh2 (A), and OVCAR7 EV and LRRC15 (B) overexpressed cells were prelabeled with fluorescent CMFDA and seeded onto the top of the LP9/TERT-1 mesothelial monolayer culture. hrs, hours. Fluorescent intensity was measured at the mentioned time points, which reflect the percent of cancer cells that gets adhered to the mesothelial layer and the percent cell adherence after normalization was plotted as mean ± SEM. C, Schematic representation of the organotypic 3D culture model of the surface layers of the omentum. OC, ovarian cancer. D, Representative images of fluorescently labeled NTC and sh1 OVCAR5 cells adhering to the 3D culture model. E, The percent adherent NTC and sh1 OVCAR5 cells were measured and plotted as mean ± SEM. F, The percent of EV and LRRC15-overexpressing (LRRC15) OVCAR7 cells adhering to the 3D culture was measured and plotted as mean ± SEM. G, OVCAR5 NTC and sh1 cells were prelabeled with CMFDA and then seeded onto the top of the culture dishes that were precoated with poly-l-lysine, collagen 1A1, fibronectin, laminin, and vitronectin, respectively. Percent adhered cells were represented as mean ± SEM. H, Schematic representation of the in vivo adhesion assay in NSG mice model of ovarian cancer. In vivo adhesion was performed by intraperitoneal injection of CMFDA-labeled NTC and LRRC15 shRNA OVCAR5 cells or EV and LRRC15 OVCAR7 cells in female NSG mice (n = 3/group). After 3 hours, the mice were sacrificed and the peritoneum/omentum tissues were collected, cancer cells dissociated, and fluorescence intensity was measured in the cell suspension. I and J, The fold change in fluorescent intensity was plotted as a measure of adhesion for NTC vs. LRRC15 shRNA cells (I) and EV vs. LRRC15 overexpressing cells (J). NS, not significant; *, P < 0.05; **, P < 0.01; ***, P < 0.001.

LRRC15 KD abrogates the adhesion phenomenon in the OC cells. A and B, OVCAR5 NTC, sh1/sh2 (A), and OVCAR7 EV and LRRC15 (B) overexpressed cells were prelabeled with fluorescent CMFDA and seeded onto the top of the LP9/TERT-1 mesothelial monolayer culture. hrs, hours. Fluorescent intensity was measured at the mentioned time points, which reflect the percent of cancer cells that gets adhered to the mesothelial layer and the percent cell adherence after normalization was plotted as mean ± SEM. C, Schematic representation of the organotypic 3D culture model of the surface layers of the omentum. OC, ovarian cancer. D, Representative images of fluorescently labeled NTC and sh1 OVCAR5 cells adhering to the 3D culture model. E, The percent adherent NTC and sh1 OVCAR5 cells were measured and plotted as mean ± SEM. F, The percent of EV and LRRC15-overexpressing (LRRC15) OVCAR7 cells adhering to the 3D culture was measured and plotted as mean ± SEM. G, OVCAR5 NTC and sh1 cells were prelabeled with CMFDA and then seeded onto the top of the culture dishes that were precoated with poly-l-lysine, collagen 1A1, fibronectin, laminin, and vitronectin, respectively. Percent adhered cells were represented as mean ± SEM. H, Schematic representation of the in vivo adhesion assay in NSG mice model of ovarian cancer. In vivo adhesion was performed by intraperitoneal injection of CMFDA-labeled NTC and LRRC15 shRNA OVCAR5 cells or EV and LRRC15 OVCAR7 cells in female NSG mice (n = 3/group). After 3 hours, the mice were sacrificed and the peritoneum/omentum tissues were collected, cancer cells dissociated, and fluorescence intensity was measured in the cell suspension. I and J, The fold change in fluorescent intensity was plotted as a measure of adhesion for NTC vs. LRRC15 shRNA cells (I) and EV vs. LRRC15 overexpressing cells (J). NS, not significant; *, P < 0.05; **, P < 0.01; ***, P < 0.001.