. 2022 Mar 15;82(6):1038–1054. doi: 10.1158/0008-5472.CAN-21-0622

Figure 4.

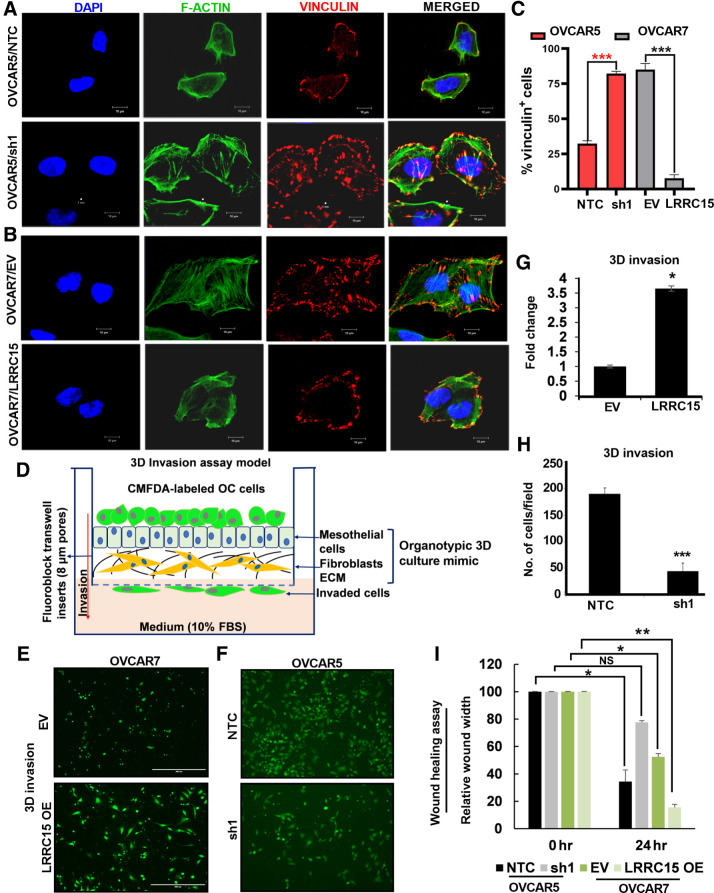
Figure 4. Altered LRRC15 expression reveals distinct pattern of FA complex formation in ovarian cancer cells. A, OVCAR5 NTC and sh1 cells were grown on fibronectin-coated coverslips for 24 hours, followed by immunofluorescence study against F-actin (green) and vinculin (red) using the confocal microscopy. DAPI was used to stain the nucleus, and the merged images are represented. B, Similar immunofluorescence assay was performed in the OVCAR7 EV and LRRC15 OE cells, and the images are provided. Scale bar, 10 μm. C, Percentage of vinculin-positive cells in a total of 50 cells was counted and is represented as bar graph. D, Schematic representation of the invasion assay through the organotypic 3D culture model of the omentum surface. E, CMFDA-labeled EV control and LRRC15 OVCAR7 cells were allowed to invade the 3D culture matrix for 12 hours, and the representative images were provided. F, Similar invasion assay was performed in the OVCAR5 NTC and sh1 cells. G–H, Percent of invaded cells was scored for the 3D invasion assay and is presented as mean ± SEM, respectively. I, Wound healing assay was performed in the OVCAR5 NTC and sh1 cells, and in the EV control and LRRC15 OE OVCAR7 cells, the relative wound width was calculated using the ImageJ software and is represented. NS, not significant; *, P < 0.05; **, P < 0.01; ***, P < 0.001.

Altered LRRC15 expression reveals distinct pattern of FA complex formation in ovarian cancer cells. A, OVCAR5 NTC and sh1 cells were grown on fibronectin-coated coverslips for 24 hours, followed by immunofluorescence study against F-actin (green) and vinculin (red) using the confocal microscopy. DAPI was used to stain the nucleus, and the merged images are represented. B, Similar immunofluorescence assay was performed in the OVCAR7 EV and LRRC15 OE cells, and the images are provided. Scale bar, 10 μm. C, Percentage of vinculin-positive cells in a total of 50 cells was counted and is represented as bar graph. D, Schematic representation of the invasion assay through the organotypic 3D culture model of the omentum surface. E, CMFDA-labeled EV control and LRRC15 OVCAR7 cells were allowed to invade the 3D culture matrix for 12 hours, and the representative images were provided. F, Similar invasion assay was performed in the OVCAR5 NTC and sh1 cells. G–H, Percent of invaded cells was scored for the 3D invasion assay and is presented as mean ± SEM, respectively. I, Wound healing assay was performed in the OVCAR5 NTC and sh1 cells, and in the EV control and LRRC15 OE OVCAR7 cells, the relative wound width was calculated using the ImageJ software and is represented. NS, not significant; *, P < 0.05; **, P < 0.01; ***, P < 0.001.