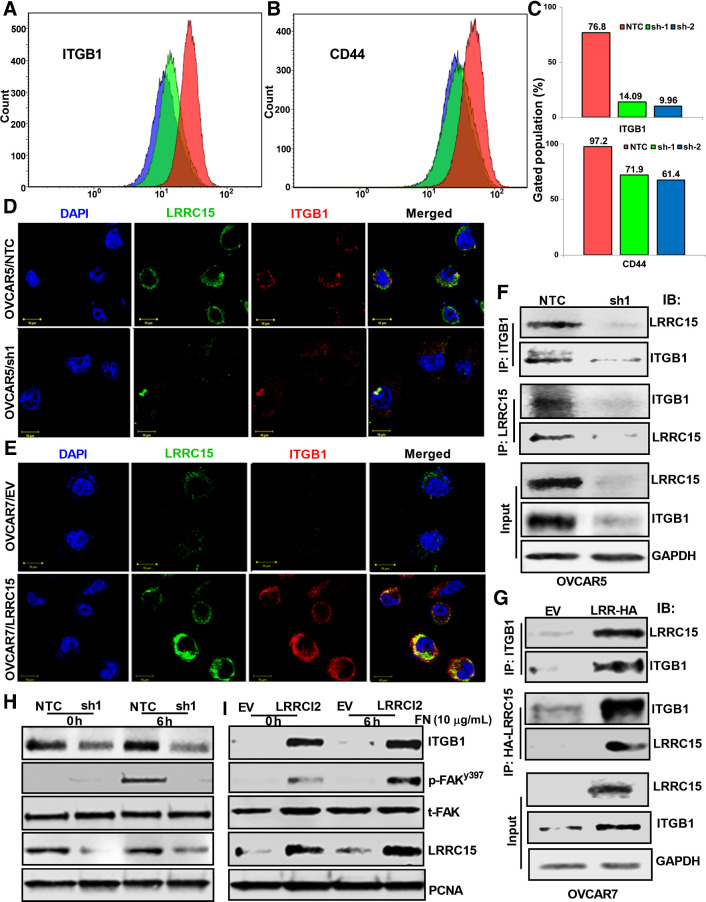
Figure 5.
β1-integrin–LRRC15 interaction activates the FAK signaling. A and B, OVCAR5 NTC, sh1, and sh2 cells were grown in fibronectin-coated plates for 24 hours, followed by flow cytometry analysis against fluorescently tagged ITGB1 and CD44. C, Percent of cells with positive signal was plotted. D and E, Colocalization studies between LRRC15 (green) and ITGB1 (red) in the OVCAR5 NTC and sh1 cells (D) and in the OVCAR7 EV and LRRCl5 cells (E) were evaluated using the confocal imaging. DAPI was used to stain the nucleus and the merged images are represented in both the cases. Scale bar, 10 μm. F, OVCAR5 NTC and sh1 cell extracts were immunoprecipitated with anti-ITGB1 and the coprecipitated LRRC15 was detected by Western blot analysis and vice versa. G, Similar immunoprecipitation studies were performed in the OVCAR7 EV and LRRC15 overexpressing cells. GAPDH was used as a loading control in both the cases. H, NTC and sh1 OVCAR5 cells were grown on FN-coated plates for 6 hours, followed by Western blot analysis. FAK pathway activation was performed by analyzing the p-FAKy397 and total FAK levels. h, hours. I, Similar immunoblot analysis of OVCAR7 EV and LRRC15 cells. Proliferating cell nuclear antigen (PCNA) was used for loading control. LRRC15 KD and OE was confirmed by probing against LRRC15 in the cell lysates, respectively.

