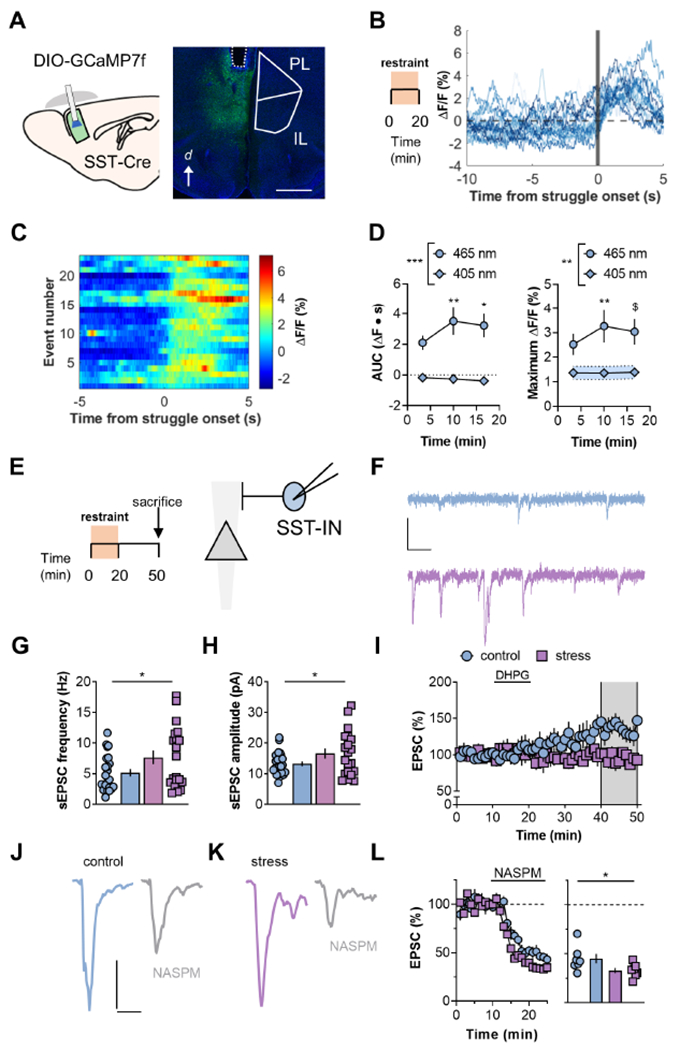
Figure 3. Excitatory drive onto PFC SST-INs is rapidly potentiated during acute stress.

(A) Left, Schematic displaying viral-assisted approach to express GCaMP7f in SST-INs. A virus promoting the expression of a double-inverted open (DIO) reading frame of GCaMP7f was delivered to the PFC of SST-Cre mice. Chronically indwelling fiberoptic cannulas were implanted. Right, representative image displaying fiber tract (dotted line) and GCaMP expression in PFC SST-INs. d, dorsal; PL, prelimbic; IL, infralimbic. Scale bar 1μm. (B) After 4 weeks recovery, animals underwent 20 minutes restraint stress while SST-IN calcium mobilization was measured via fiber photometry. Representative experiment displaying SST-IN calcium mobilization occurring immediately following behavioral struggling episodes. (C) Heat map of representative experiment. Each row denotes SST-GCaMP signal aligned to a behavioral event in chronological order. (D) Binned data over multiple subjects. Left, The area under the curve (AUC) of the event-locked SST-GCaMP Ca2+-dependent signal (465-nm) increased during a single exposure to restraint stress (RM Two-way ANOVA time x wavelength interaction: F2,16=4.3, p<0.04; main effect of wavelength: F1,8=22.7, p<0.001; *:p<0.05, **:p<0.01 vs. Bin 1, Sidak test, N=9 mice). Fluorescent signals on the Ca2+-independent isobestic control channel (405 nM) were not readily detected following struggling episodes. Right, restraint stress potentiated the maximum increase in SST-GCaMP7f fluorescence locked to struggling episodes without altering the isobestic control channel (RM Two-way ANOVA time x wavelength interaction: F2,16=3.2, p<0.08; main effect of wavelength: F1,8=11.9, p<0.001; $:p<0.06, **:p<0.01 vs. Bin 1, Sidak test, N=9). (E) Mice were sacrificed for whole-cell electrophysiology 30 minutes following restraint stress. Recordings were made from SST-INs with soma in layer 5 PFC. (F) Representative traces depicting SST-IN spontaneous EPSCs (sEPSCs) from a control mouse (top, blue) and a mouse that experienced restraint stress (bottom, purple). Scale bars 20pA, 50ms. (G) Restraint stress rapidly increased sEPSC frequency (7.7±1.1 vs 5.1±0.6 Hz; t41=2.1, *:p<0.05, t-test). n/N=20-23/6-9. (H) sEPSC amplitude was greater in SST-INs from restraint group (16.6±1.6 vs 12.9±0.7 pA; t41=2.19, *:p<0.05, t-test). n/N=20-23/6-9. (I). Restraint stress disrupted mGlu5 receptor LTP (95±7 vs 131±11%; t16=2.49 *:p<0.05, t-test). n/N=7-11/5-9. (J/K) Representative traces displaying SST-INs EPSCs before and after NASPM. (L) Summarized timecourse and average of last 5 minutes of NASPM experiments. SST-IN EPSCs displayed greater sensitivity to NASPM in animals that experienced restraint stress (33±3 vs 45±5%; t12=2.2, p<0.05, t-test). n/N = 7/5.
