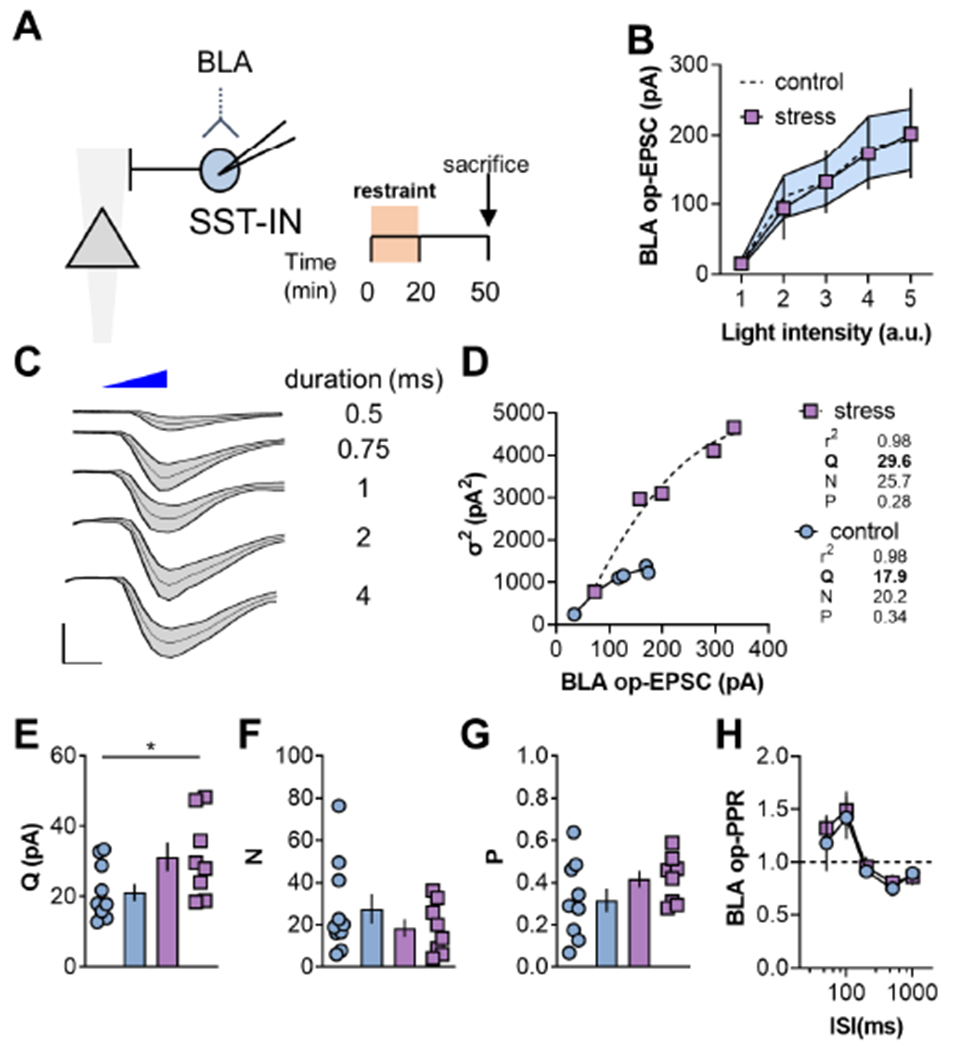
Figure 4. Restraint stress increases postsynaptic strength at BLA inputs onto SST-INs.

(A) BLA op-EPSCs on SST-INs were collected in control mice and following restraint stress. (B) No difference in BLA op-EPSC amplitude in SST-INs from control and stress mice. Control data also presented in Figure 2C. (C) Representative traces displaying BLA op-EPSC amplitude and standard deviation (σ) across a range of light stimulation durations. Scale bars 100pA, 2ms. (D) Representative multiple probability fluctuation analysis (MPFA) experiments. For each SST-IN, a quadratic equation was fit to the op-EPSC amplitude and variance (σ2). The quantal size (Q), number of synapses (N), and glutamate release probability (P), can be derived from the curve fit parameters. (E) Restraint stress increased Q at BLA synapses on SST-INs (31.3±4.1 vs 21.2±2.4pA; t16=2.2, p<0.05, t-test). n/N = 8-10/4 cells/mice. (F) Restraint stress did not affect the N at BLA inputs onto SST-INs. (G) P from BLA to SST-INs was not affected by restraint stress. (H) BLA op-EPSC PPR was not different on SST-INs from control versus stress groups. n/N = 7-8/3
