. 2022 Mar 15;82(6):1110–1127. doi: 10.1158/0008-5472.CAN-21-1397

Figure 1.

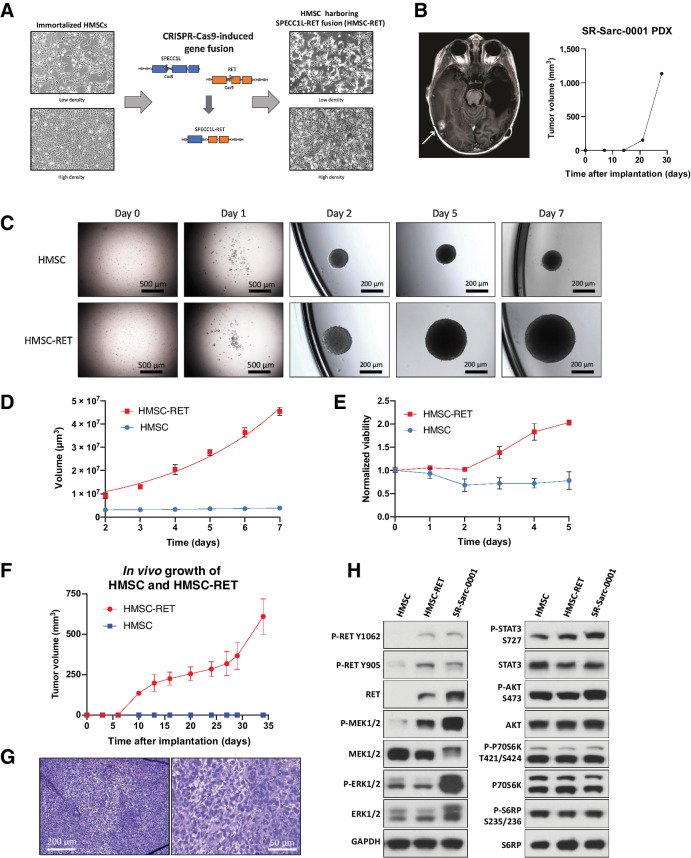
Figure 1. Establishment of novel SPECC1L-RET–rearranged sarcoma models. A, Generation of a SPECC1L-RET chromosomal rearrangement using CRISPR-Cas9–mediated genomic engineering in immortalized HMSC. B, Imaging of the brain metastasis of the SPECC1L-RET–rearranged sarcoma (left) that was used to establish SR-Sarc-0001 PDX (PDX growth in time is depicted in the right panel) C, HMSC and HMSC-RET cells were plated into ultra-low attachment plates to form spheroids and images were captured every 24 hours. Data represent the mean ± SD of 10 measurements. D, Spheroid volume. E, Metabolic activity of the spheroids was measured every 24 hours using alamarBlue cell viability dye. Resulting values were normalized to the initial values obtained at the first measurement (24 hours after seeding). Data represent mean ± SD of 12 measurements. F, HMSCs and HMSC-RET cells were implanted subcutaneously (10 million cells per implantation) to assess tumorigenesis. All HMSC-RET implantations resulted in tumors (100% penetrance), while HMSCs did not form tumors. Data represent the mean ± SD of 4 tumors. G, HMSC-RET xenografts were extracted, fixed in formalin, and embedded in paraffin. Hematoxylin and eosin staining of the obtained tissue slides is shown. H, HMSC, HMSC-RET, and SR-Sarc-0001 cells were serum-starved for 24 hours and then whole-cell extracts were prepared for Western blot profiling for the total and phosphorylated proteins shown.

Establishment of novel SPECC1L-RET–rearranged sarcoma models. A, Generation of a SPECC1L-RET chromosomal rearrangement using CRISPR-Cas9–mediated genomic engineering in immortalized HMSC. B, Imaging of the brain metastasis of the SPECC1L-RET–rearranged sarcoma (left) that was used to establish SR-Sarc-0001 PDX (PDX growth in time is depicted in the right panel) C, HMSC and HMSC-RET cells were plated into ultra-low attachment plates to form spheroids and images were captured every 24 hours. Data represent the mean ± SD of 10 measurements. D, Spheroid volume. E, Metabolic activity of the spheroids was measured every 24 hours using alamarBlue cell viability dye. Resulting values were normalized to the initial values obtained at the first measurement (24 hours after seeding). Data represent mean ± SD of 12 measurements. F, HMSCs and HMSC-RET cells were implanted subcutaneously (10 million cells per implantation) to assess tumorigenesis. All HMSC-RET implantations resulted in tumors (100% penetrance), while HMSCs did not form tumors. Data represent the mean ± SD of 4 tumors. G, HMSC-RET xenografts were extracted, fixed in formalin, and embedded in paraffin. Hematoxylin and eosin staining of the obtained tissue slides is shown. H, HMSC, HMSC-RET, and SR-Sarc-0001 cells were serum-starved for 24 hours and then whole-cell extracts were prepared for Western blot profiling for the total and phosphorylated proteins shown.