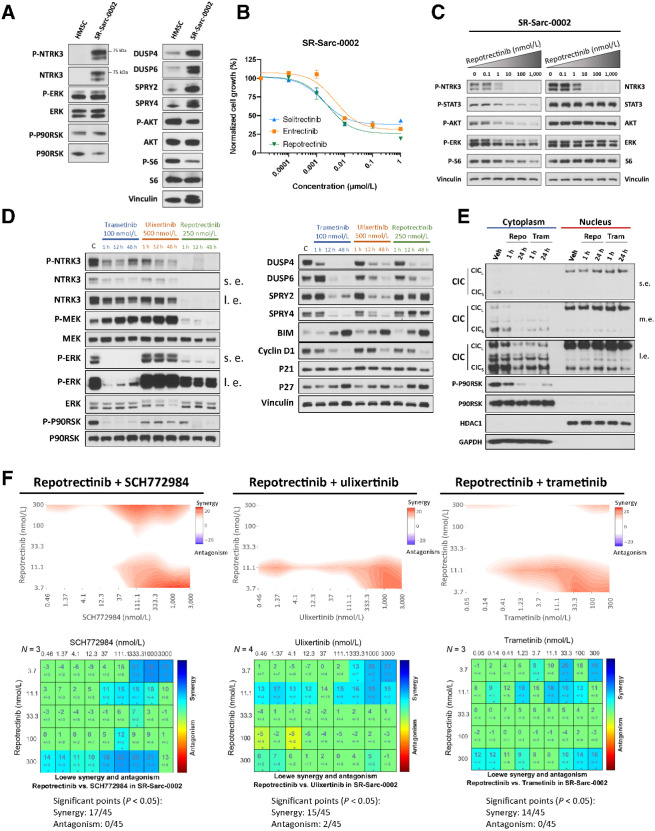
Figure 8.
ETV6-NTRK3–rearranged sarcoma model confirms a broad role of MAPK regulation in RTK oncogenesis and response to therapy. A, HMSC and SR-Sarc-0002 (ETV6-NTRK3F617I–rearranged infantile fibrosarcoma cell line) cells were serum-starved for 24 hours and then whole-cell extracts were prepared for Western blot profiling. B, SR-Sarc-0002 cell were treated with the indicated doses of repotrectinib (TPX-0005), entrectinib, and selitrectinib (LOXO-195) for 96 hours and then cell viability was assessed using alamarBlue. Data represent the mean ± SD of three measurements. C, SR-Sarc-0002 cells were treated with the indicated doses of repotrectinib for 90 minutes and then whole-cell extracts were prepared for Western blot profiling. D, SR-Sarc-0002 cells were treated with trametinib (100 nmol/L), ulixertinib (500 nmol/L), or repotrectinib (250 nmol/L) for the indicated times and then whole-cell extracts prepared for Western blotting. s.e., shorter exposure; l.e., longer exposure. E, SR-Sarc-0002 cells were treated with repotrectinib (250 nmol/L) or trametinib (100 nmol/L) for 1 and 24 hours and nuclear and cytoplasmic extracts were prepared for Western blotting. Repo, repotrectinib 250 nmol/L; Tram, trametinib 100 nmol/L; m.e., medium exposure. F, SR-Sarc-0002 cells were treated with the indicated combinations of repotrectinib and SCH772984 (left), repotrectinib and ulixertinib (middle), and repotrectinib and trametinib (right) for 96 hours and then cell viability was determined. Loewe synergy analysis was applied to determine the synergy scores and their statistical significance for each combination. Resulting scores are shown as a contour map (top) or a matrix table (bottom). Representative immunoblots from two independent experiments are shown in A, C, D, E.

