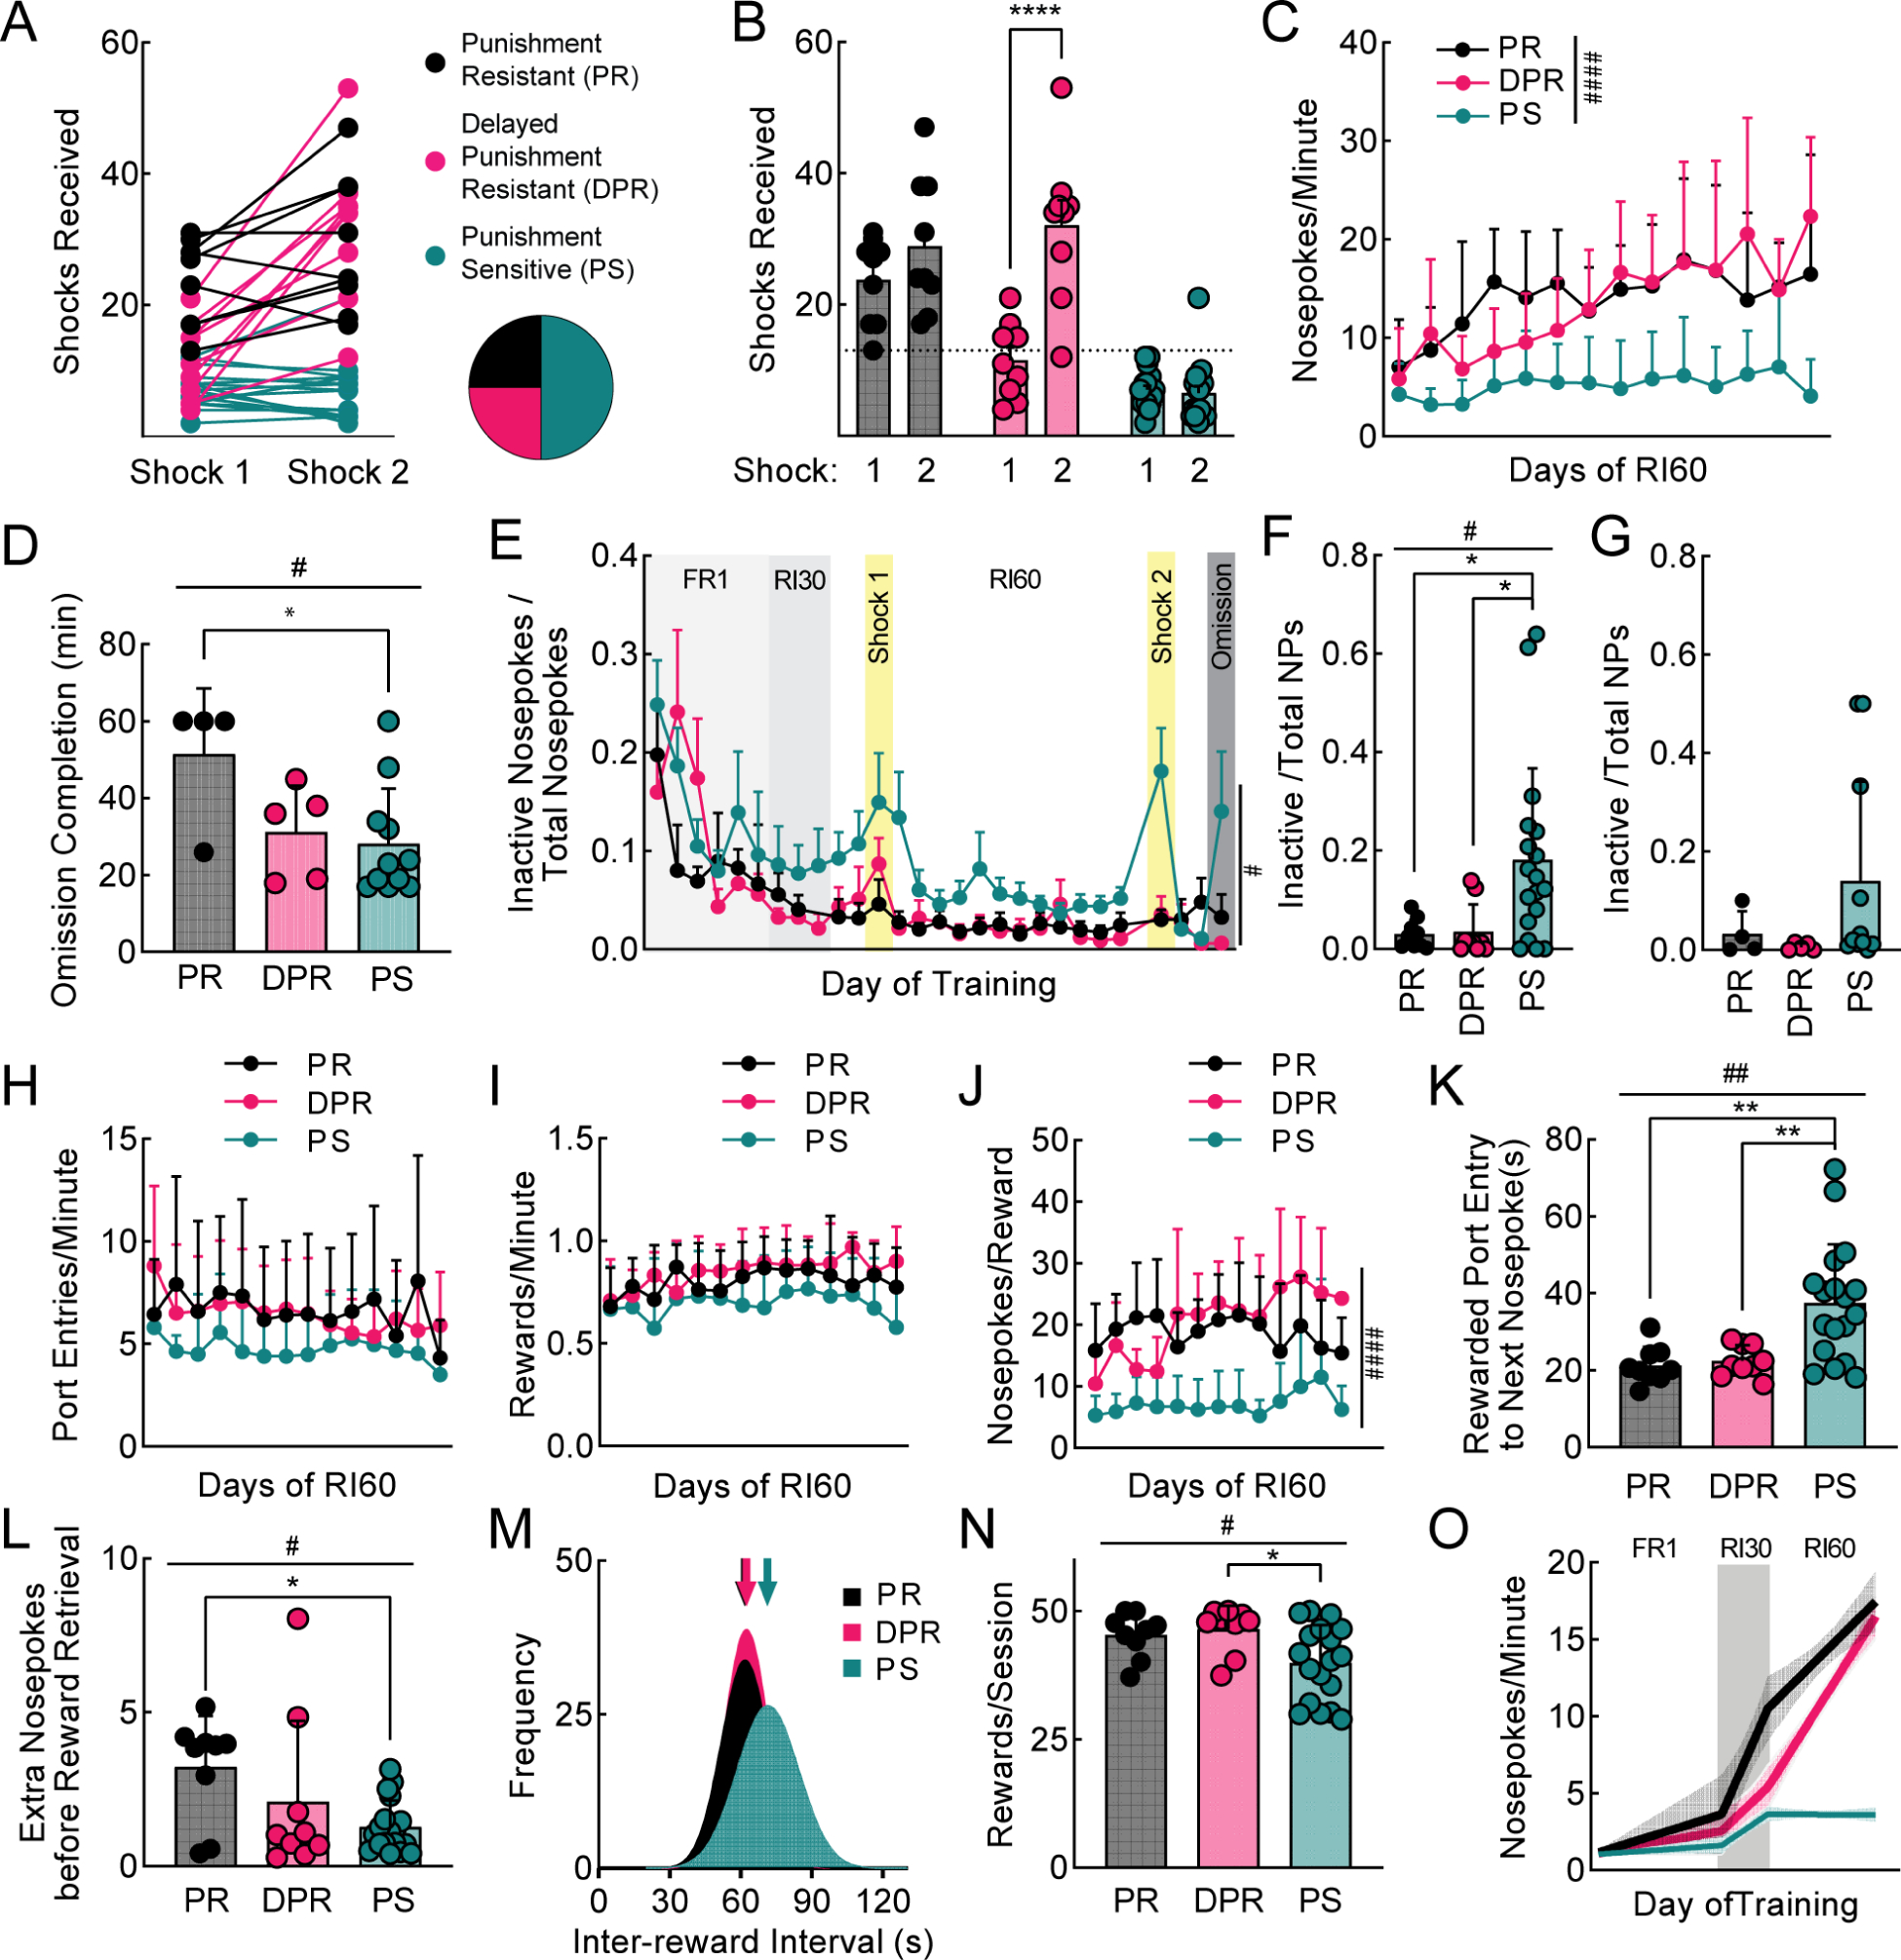
Figure 2. Three punishment-related phenotypes emerge with extended RI60 training.

A. Shocks received by RI60-trained mice (same data as Fig. 1D). Individuals represented by points connected with lines. Mice were classified as punishment resistant (PR; black), delayed punishment resistant (DPR; pink), or punishment sensitive (PS; teal) based on number of shocks received during shock probes (see Methods; n=9 PR, n=9 DPR, n=18 PS for all panels, unless specified). Pie chart shows proportions of PR, DPR, and PS mice. B. Average shocks received on early and late shock probes for each phenotype. C. Average nosepokes per minute across RI60 training by phenotype. D. Average time to complete omission probe (PR n=4, DPR n=5, PS n=11). E. Average nosepokes on inactive port as a fraction of total nosepokes across training. F. Average nosepokes on inactive port as a fraction of total nosepokes during second shock probe. G. Average nosepokes on inactive port as a fraction of total nosepokes during omission probe (PR n=4, DPR n=5, PS n=11). H. Average number of port entries per minute across RI60 training. I. Average number of rewards earned per minute across RI60 training. J. Average nosepokes per reward across RI60 training. K. Average time from rewarded port entry to next nosepoke. L. Average unrewarded “extra” nosepokes made following rewarded nosepoke, prior to rewarded port entry. M. Distribution of inter-reward interval times for each group. Arrows represent mean. N. Average rewards earned per RI60 session. O. Segmental linear regression showing slope of nosepokes made per minute in FR1, RI30, and RI60 schedules. Shaded region represents 95% confidence bands. All error bars represent SD. Main effects #p<0.05, ##p<0.01, ###p<0.001, ####p<0.0001. Multiple comparisons *p<0.05, **p<0.01, ****p<0.0001. See also Figure S2.
