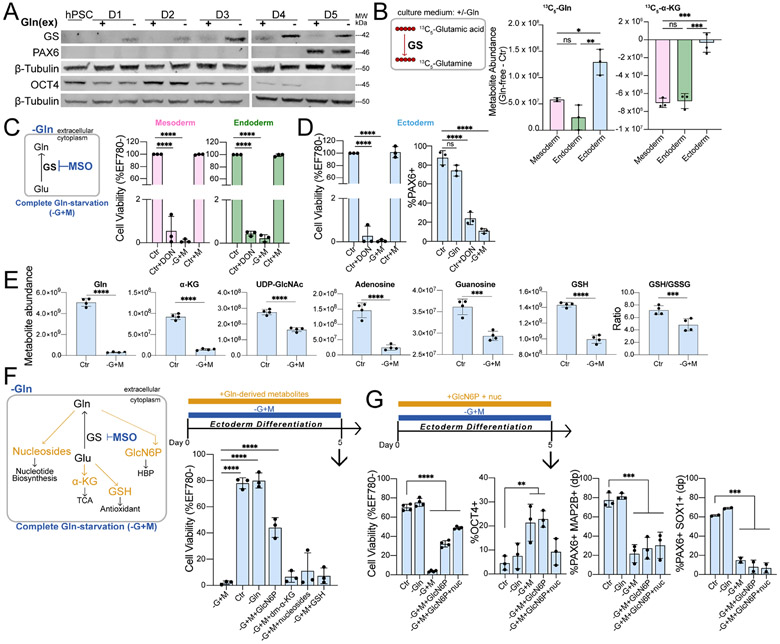
Figure 2. Sufficient Gln synthesis distinguish ectoderm from other germ lineages.
(A) Immunoblot of GS, PAX6, and OCT4 expression during H9-derived ectoderm differentiation in Gln-free conditions.
(B) Difference in 13C5-Gln and 13C5-α-KG amounts derived from 13C5-glutamic acid in Gln-free (−Gln) relative to supplemented (Ctr) conditions.
(C-D) (Left) Complete Gln-starvation (−G+M) is attained by culturing cells in Gln-free media and inhibiting de novo Gln synthesis with 1 mM MSO. (Right) Cell viability of (C) mesoderm, endoderm and (D) differentiation of ectoderm cells grown in Gln-free (−Gln) conditions with 50 μM DON or 1 mM MSO relative to Gln-supplemented (Ctr) media.
(E) Metabolite abundance quantified by UHPLC-MS in differentiated ectoderm cells treated in Gln-supplemented (Ctr) or 1h Gln-starvation (−G+M) conditions.
(F) (Top) Schematic of Gln-starvation (−G+M) supplemented with individual cell-permeable Gln-derived metabolites. (Bottom) Cell viability of H9-derived D5 ectoderm cells differentiated in Gln-starvation and supplemented with GlcN6P, dm-α-KG, nucleosides, or GSH.
(G) Cell viability and percentage of ectoderm (PAX6+MAP2B+ double positive (dp), PAX6+SOX1+ (n=2)) and pluripotent (OCT4+) biomarkers in H9-derived D5 ectoderm cells grown in Gln-starvation with added GlcN6P or both GlcN6P and nucleosides.
Data represent mean ± SD of n ≥ 3 biological replicates unless indicated otherwise. *p ≤ 0.05; **p ≤ 0.01; ***p ≤ 0.001; ****p ≤ 0.0001. The p values were determined by (B-D, F, G) one-way ANOVA, or (E) unpaired two-tailed Student’s t test with correction for multiple comparisons.

