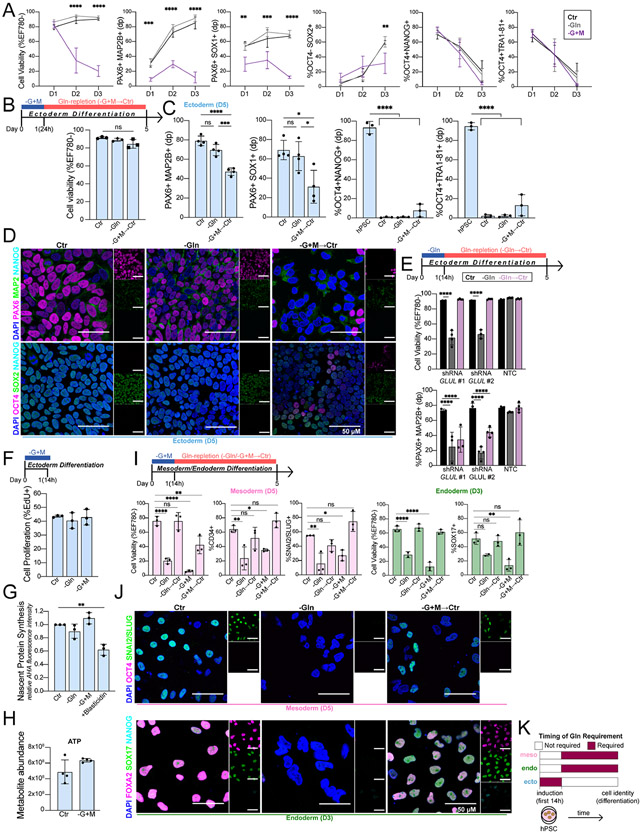
Figure 3. Gln is required at the initiation of ectoderm, but not mesoderm and endoderm.
(A) Cell viability and percentage of ectoderm (PAX6+MAP2B+, PAX6+SOX1+, OCT4− SOX2+) and pluripotent (OCT4+NANOG+, OCT4+TRA1-81+) biomarkers in H9-derived ectoderm cells grown continuously in Gln-starvation for D1 (24h), D2 (48h), and D3 (72h).
(B) (Top) Schematic of pulsed Gln-starvation experiments. Ectoderm cells were Gln-starved for the first 24h of differentiation then switched to Gln-supplemented media (Gln-repletion, −G+M→Ctr) until D5. (Bottom) Cell viability of H9-derived D5 ectoderm cells after initial 24h Gln-starvation.
(C) Percentage of ectoderm (PAX6+MAP2B+, PAX6+SOX1+) and pluripotent (OCT4+NANOG+, OCT4+TRA1-81+) biomarkers in H9-derived D5 ectoderm cells after initial 24h Gln-starvation (−G+M→Ctr).
(D) Representative immunofluorescence images of ectoderm and pluripotent biomarkers in H9-derived D5 ectoderm cells grown in Gln-supplemented (Ctr), Gln-free (−Gln), or Gln-repletion after initial 24h Gln-starvation (−G+M→Ctr). (Top) PAX6 (magenta, ectoderm;) MAP2B (green, ectoderm); NANOG (cyan, pluripotent). (Bottom) OCT4 (magenta, pluripotent); SOX2 (green, ectoderm/pluripotent); NANOG (cyan, pluripotent). Scale bar indicates 50 μm.
(E) H9-derived ectoderm expressing shRNA targeting GLUL (shRNA GLUL #1; shRNA GLUL #2) or a non-targeting control (NTC). Cell viability and percentage of PAX6+MAP2B+ D5 ectoderm cells in Gln-supplemented (Ctr), Gln-free (−Gln), or Gln-repletion after initial 14h Gln-free treatment (Gln→Ctr).
(F) Percentage of proliferating H9-derived ectoderm cells (EdU+ staining) immediately after 14h Gln-free or Gln-starvation treatment.
(G) Nascent protein synthesis in H9-derived ectoderm cells immediately after 14h Gln-free, Gln-starvation, or blasticidin treatment relative to Ctr.
(H) ATP levels, quantified by UHPLC-MS, in ectoderm cells after Gln-starvation.
(I) Cell viability and percentage of H9-derived D5 mesoderm (CD34+, SNAI2/SLUG+) and D3 endoderm (SOX17+) cells after initial 14h Gln-free (−Gln→Ctr) or Gln-starvation (−G+M→Ctr) treatment.
(J) Representative immunofluorescence images of pluripotent and lineage-specific biomarkers in H9-derived (Top) D5 mesoderm and (Bottom) D3 endoderm cells grown in Gln-supplemented (Ctr), Gln-free (−Gln), or Gln-repletion follow initial 14h Gln-starvation (−G+M→Ctr). (Top) OCT4 (magenta, pluripotent); SNAI2/SLUG (green, mesoderm). (Bottom) FOXA2 (magenta, endoderm); SOX17 (green, endoderm); NANOG (cyan, pluripotent). Scale bar indicates 50 μm.
(K) Timing of Gln requirement for downstream lineage cell identity.
Data represent mean ± SD of n ≥ 3 biological replicates. *p ≤ 0.05; **p ≤ 0.01; ***p ≤ 0.001; ****p ≤ 0.0001. The p values were determined by (A-C, F-G, I) one-way ANOVA, (E) two-way ANOVA with correction for multiple comparisons or (H) unpaired two-tailed Student’s t test.

