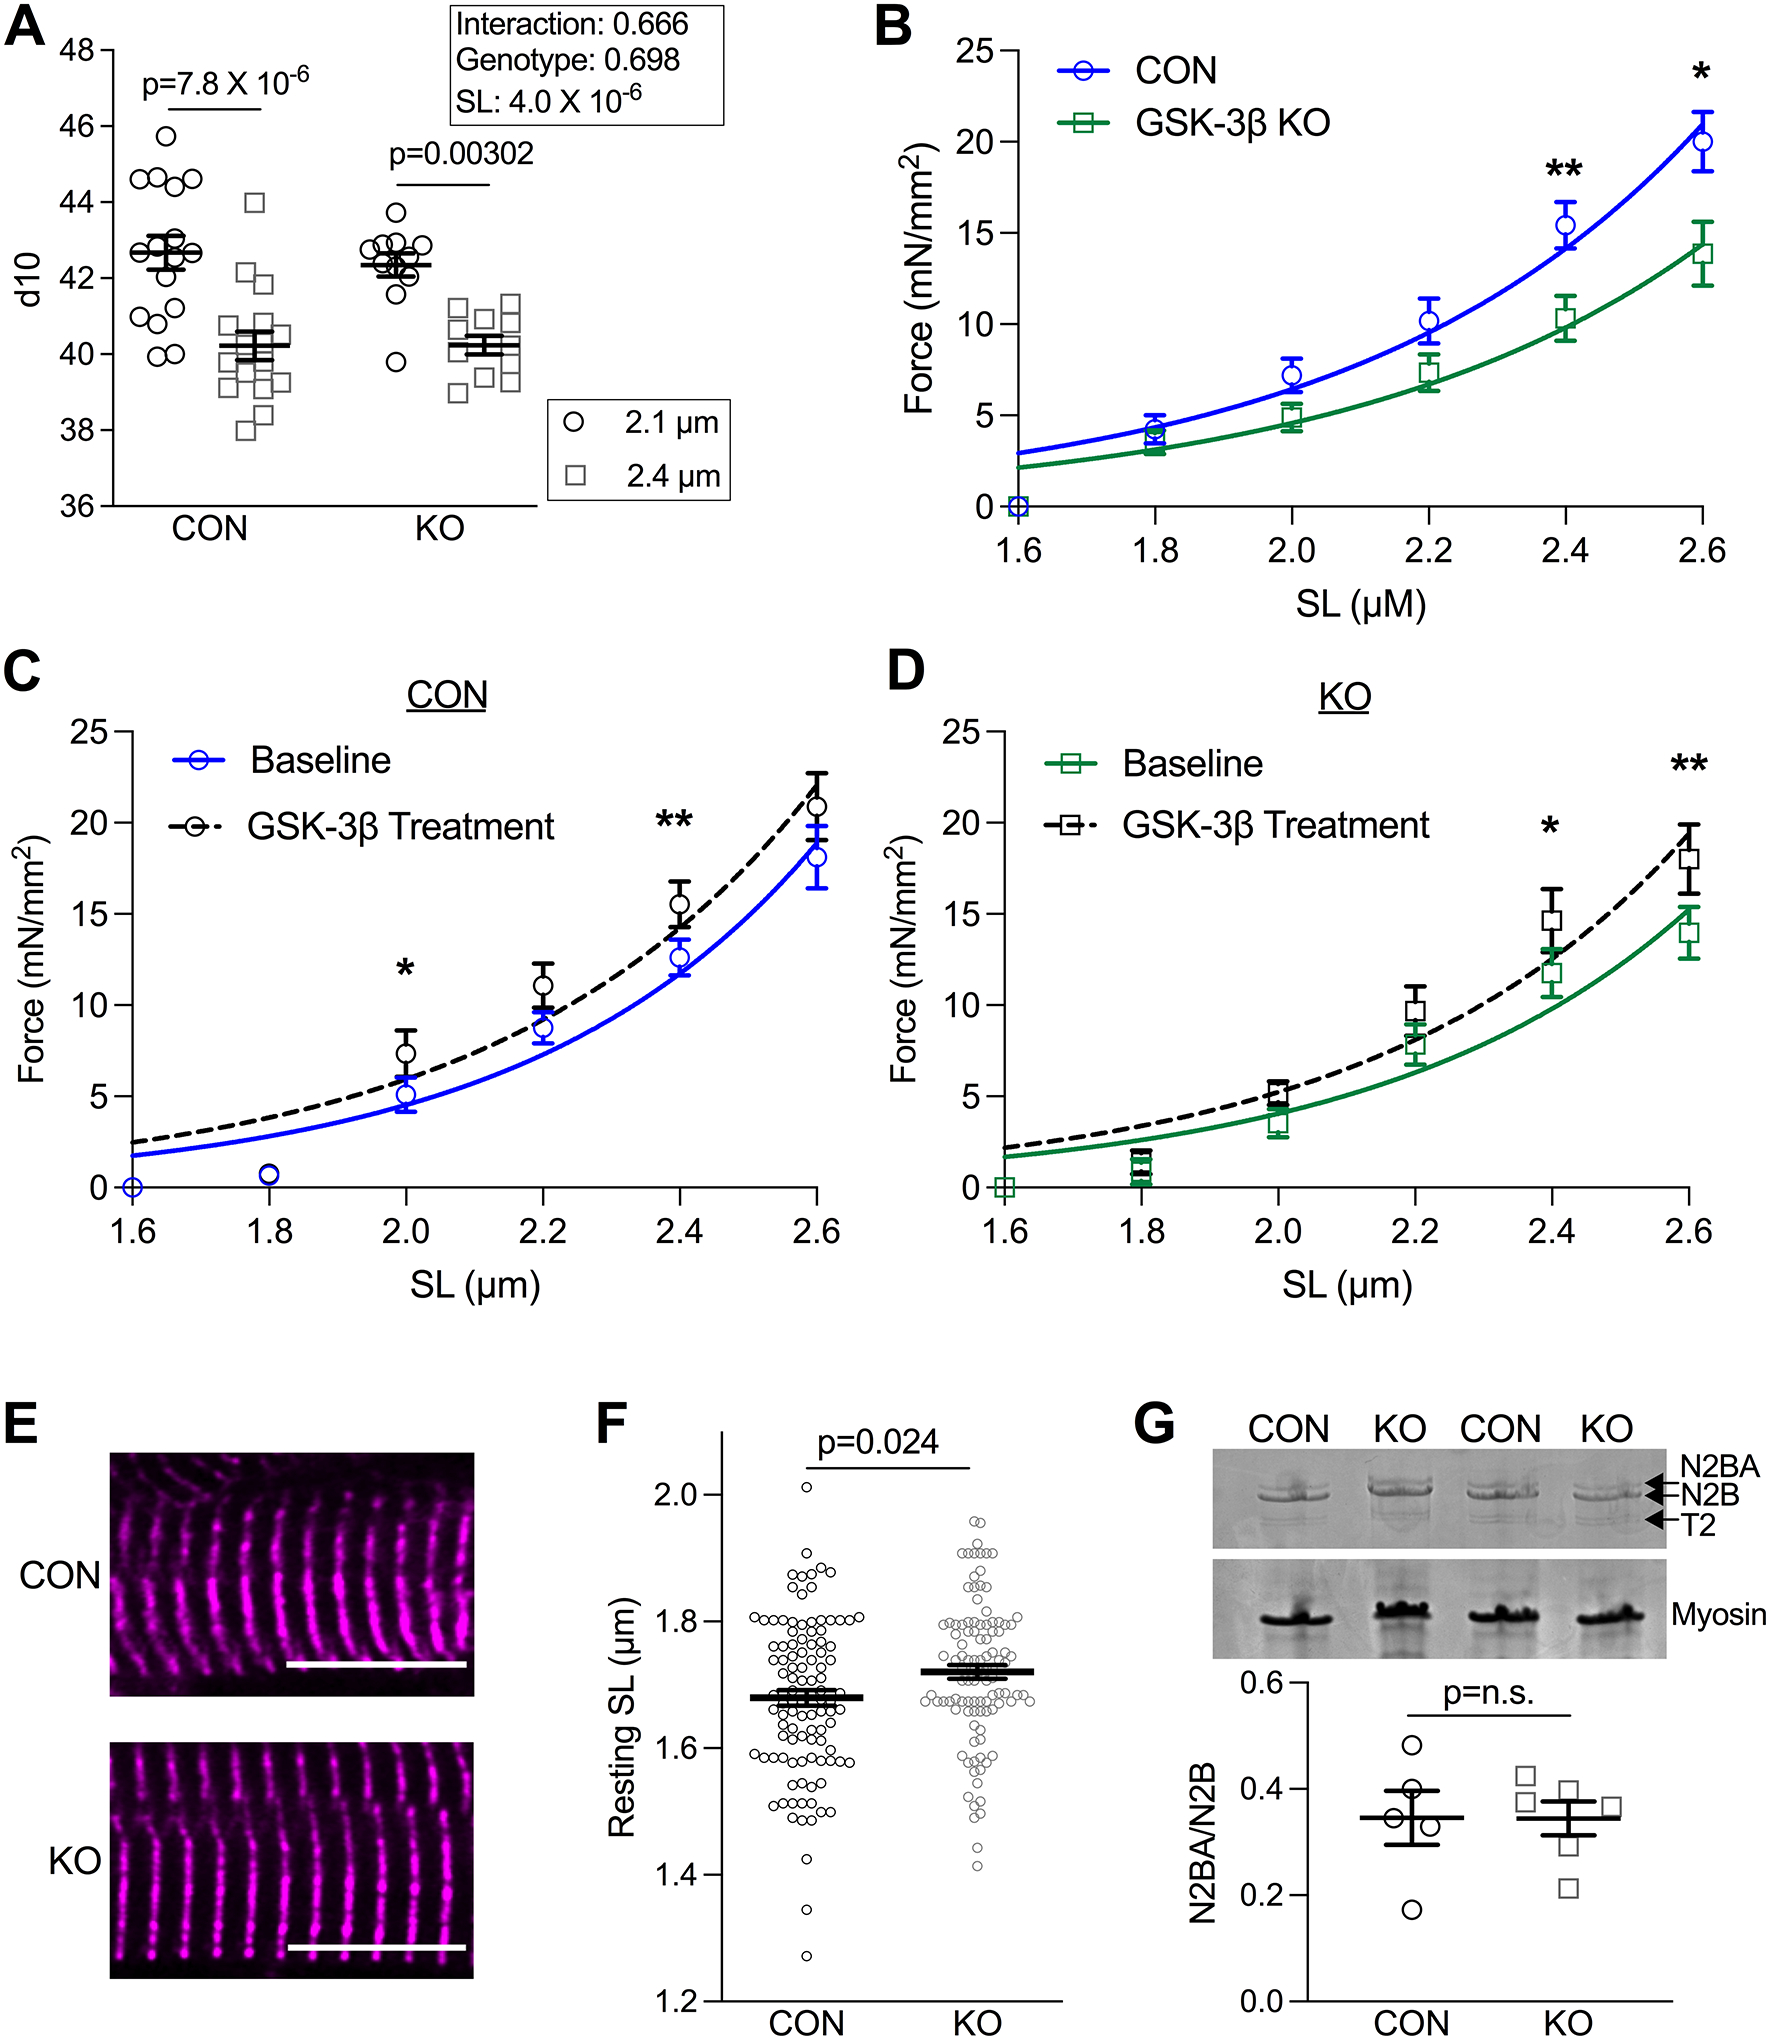
Figure 2. GSK-3β KO mice have increased titin compliance.

(A) Summary d10 (lattice spacing) collected by x-ray diffraction data from skinned papillary muscle fibers from CON (16 fibers from 6 animals) and GSK-3β KO mice (11 fibers from 4 animals). Fibers were measured at SL 2.1 and 2.4 μm. (effect of SL p=4.0 × 10⁻⁶ by repeated measures 2-way ANOVA with Sidak’s multiple pair-wise comparison test). (B) Passive tension measured in CON and GSK-3β KO mice at SLs from 1.6 to 2.6 μm. (p-values determined by unpaired parametric t-test, with the exception of data collected at 2.0, which was determined by Mann-Whitney T-test). Passive tension measured in (C) CON (n=3 mice/4–5 cells per mouse; p-values: 1.8=0.88W, 2.0=0.022W, 2.2=0.060P, 2.4=0.011W, 2.6=0.15P) and (D) KO mice (n=3 mice/4–5 cells per mouse; p-values: 1.8=0.69W, 2.0=0.080W, 2.2=0.20P, 2.4=0.043P, 2.6=0.0073P) at baseline and with GSK-3β treatment. P-values were determined by paired t-test, pParametric test, WNon-parametric Wilcoxon Test. (E) Representative images of fixed tissue from CON and KO mice in which the z-disc is designated with α-actinin (n=30 cells/animal from 3 animals/group). Scale bar = 10 um. (F) Summary data of resting SL (μm) (p=0.024 by Mann-Whitney t-test) shown as means ± SEM. (G) Representative Coomassie stained gel with quantification below of CON and GSK-3β KO mice in which titin isoforms N2BA, N2B, degraded titin (T2), and myosin are indicated by arrows (n= 5–6 mice/group). P-value was determined by Mann-Whitney-test.
