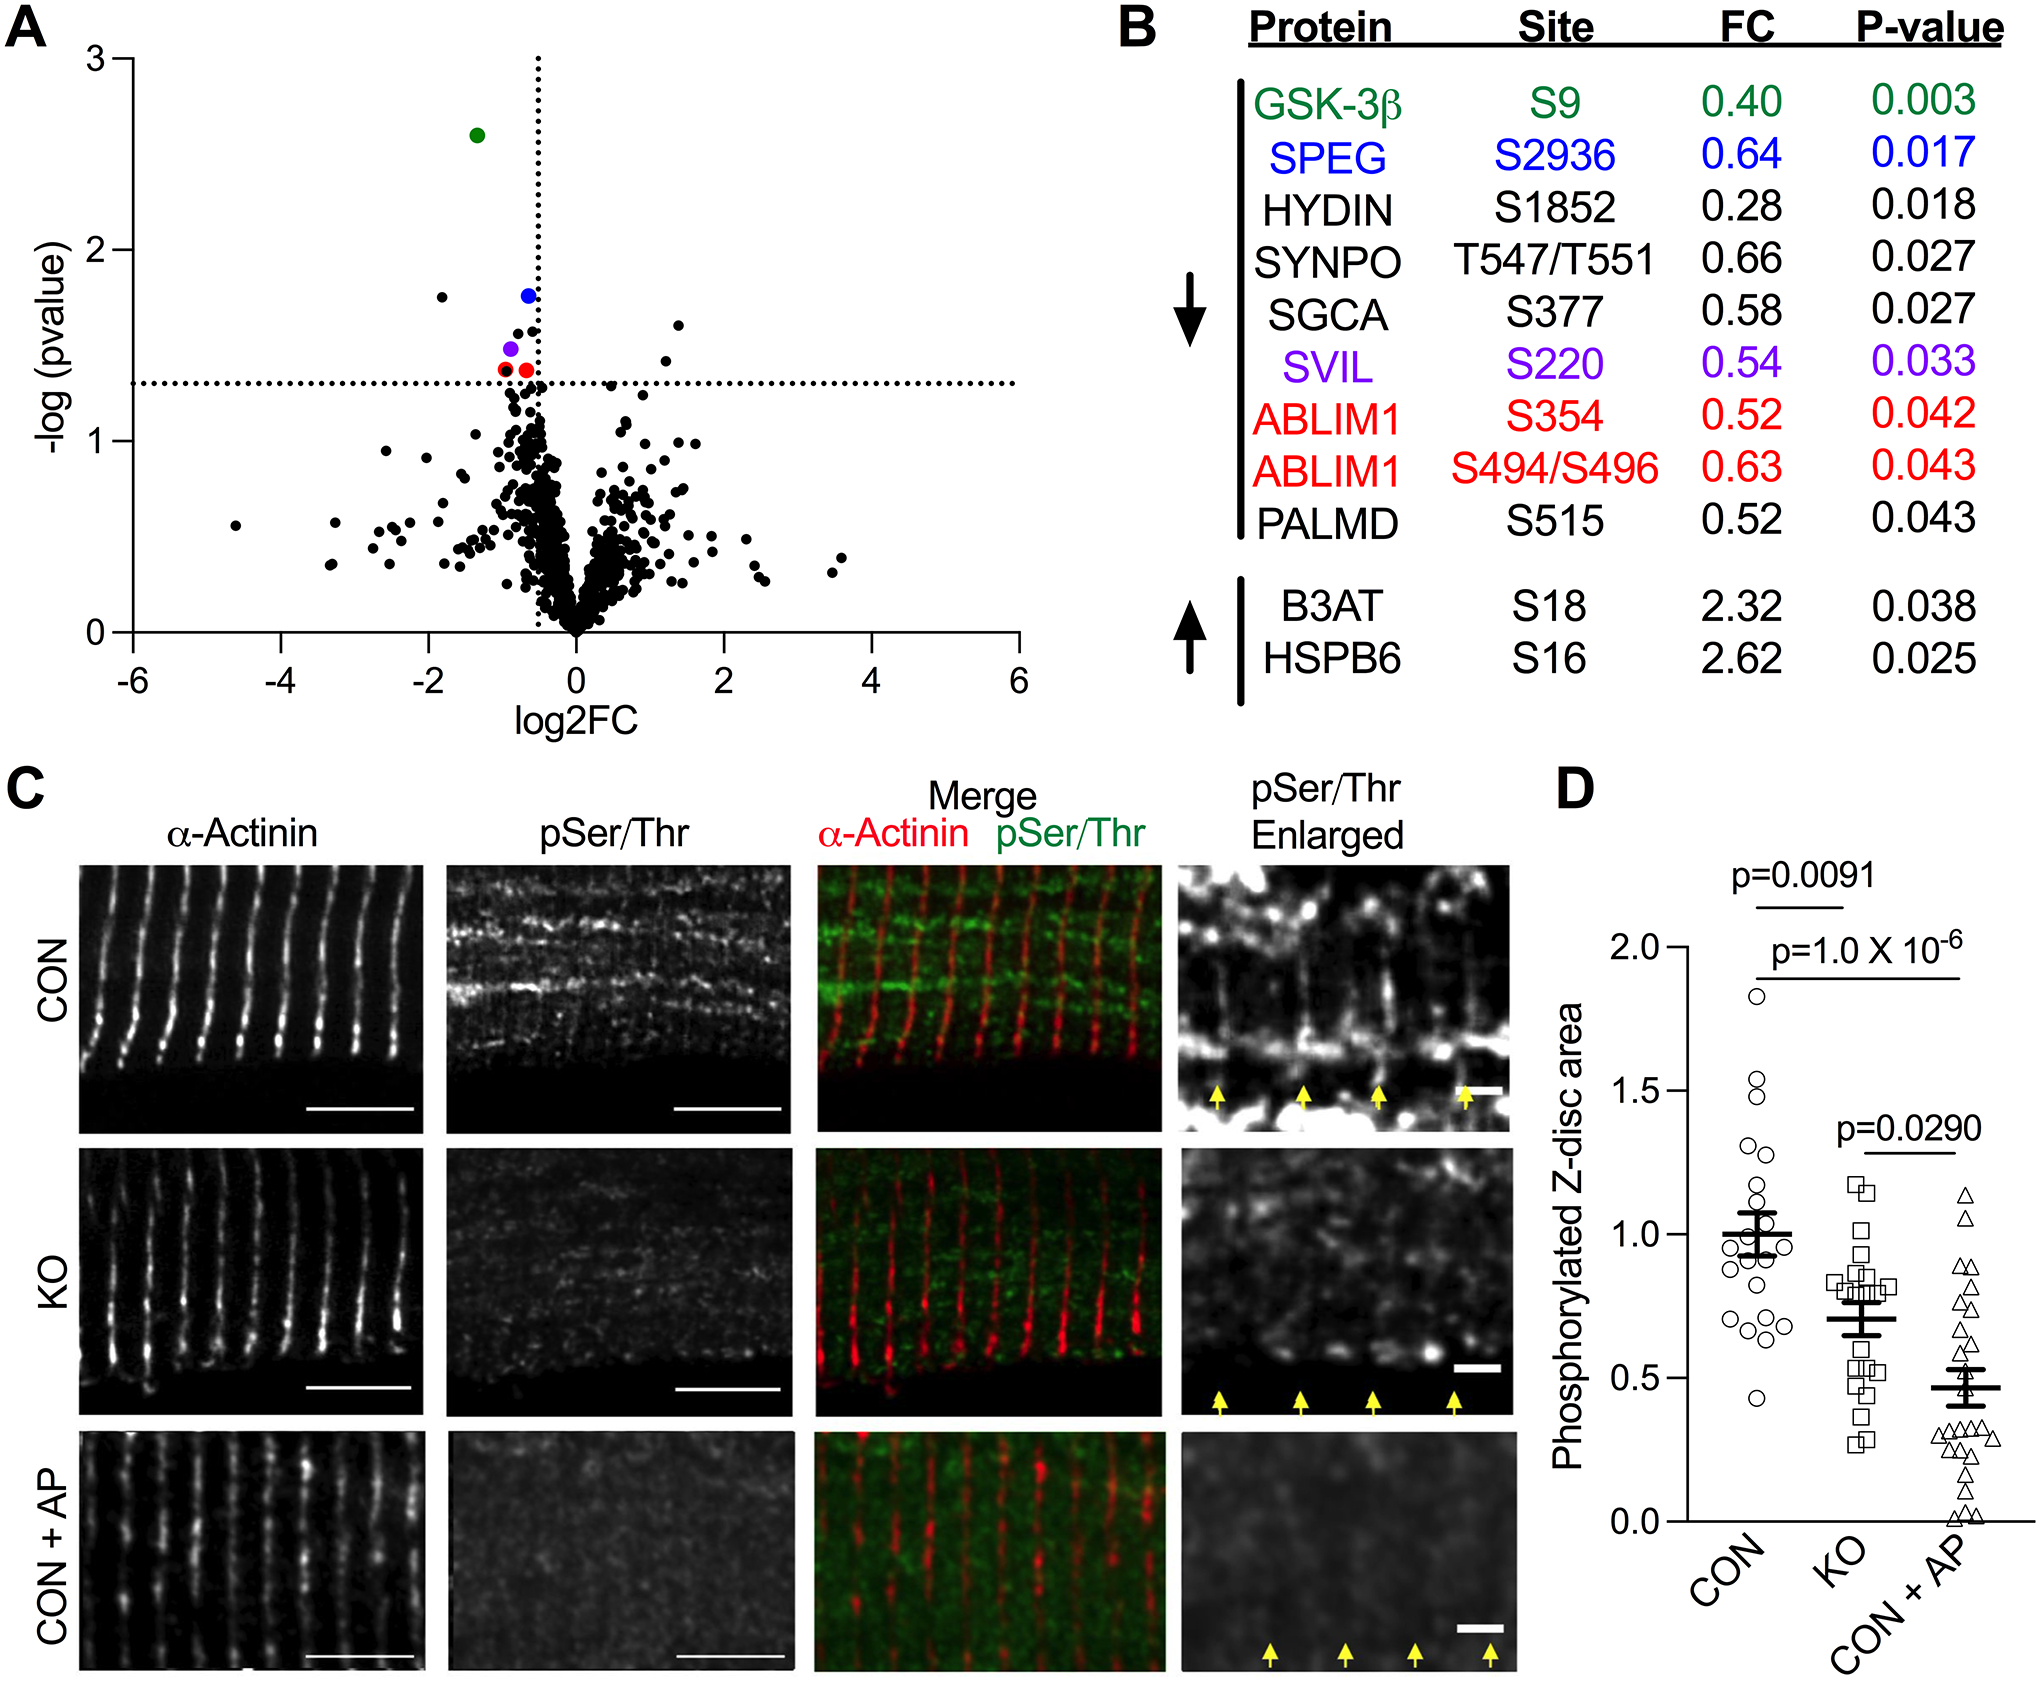
Figure 3. GSK-3β phosphorylates z-disc proteins.

(A) Volcano plot depicting phosphorylation sites in CON (n=4) and GSK-3β KO (n=5) mice identified by mass spectrometry. Cut-offs for p-value are displayed at p=0.05 and for a fold change of a 30% decrease. (B) Significantly downregulated and upregulated sites. Proteins shown to localize to the z-disc are color coded to their respective points on the volcano plot. (C) Representative immunofluorescence from CON and GSK-3β KO LV tissue in which samples were probed for the z-disc marker ⍺-actinin (red in merged image) and phosphorylated Serine/Threonine residues (green in merged image). A subset of CON tissue was pre-incubated with alkaline phosphatase to act as a positive control (Phosphatase). Scale bar = 5 μm (2 μm in enlarged images). Yellow arrows delineate z-discs. (D) Quantification of Z-disc area containing pSer/Thr staining (normalized to control). n=3 mice, 21–26 cells/group, 10 z-discs/cell. P-values were calculated via one-way ANOVA with Tukey’s multiple comparison test.
