
Figure 5. abLIM-1 localizes to the z-disc and modulates passive stiffness via titin.
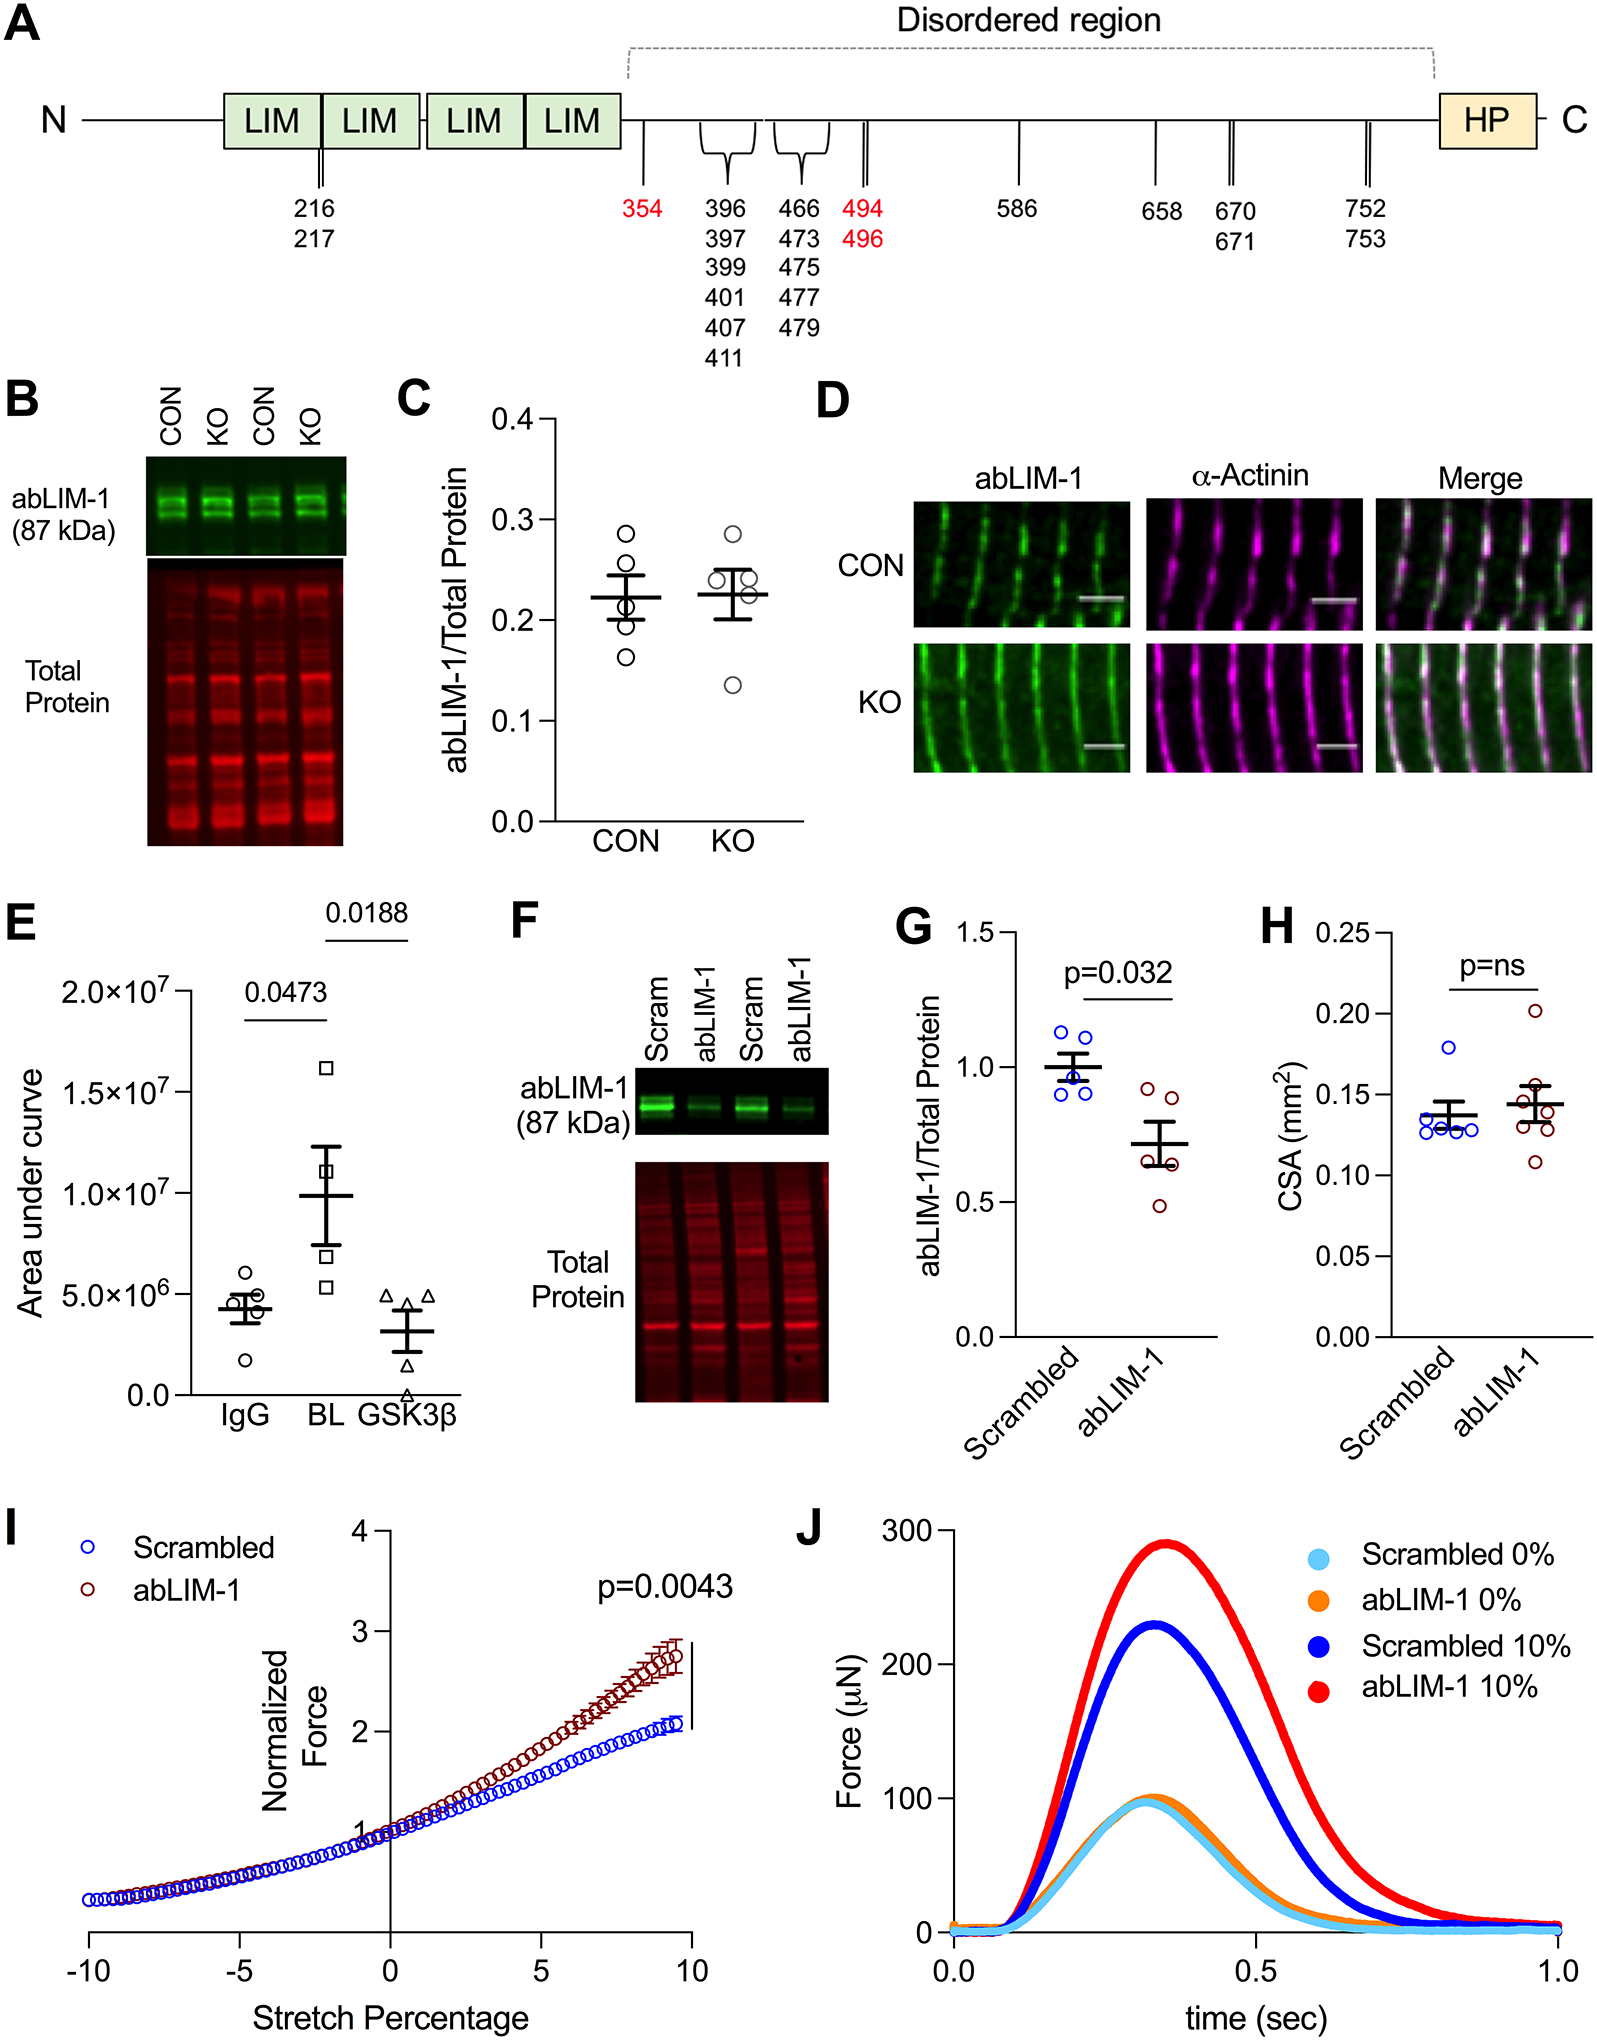
(A) Graphic of abLIM-1 domains and phosphorylation sites. Sites depicted in black are unchanged in GSK-3β KO mice, and sites depicted in red were reduced. (B) Representative western blot of abLIM-1 in whole tissue lysis of CON and GSK-3β KO mice. (C) abLIM-1 normalized to total protein in CON and KO mice (n=5). Statistics were calculated via Mann-Whitney test (D) abLIM-1 (green) and α-actinin (pink) staining in CON and GSK-3β KO mouse LV. (E) Quantification (area under the curve) of Z1Z2 titin peptides non-specifically bound (IgG control) and pulled down by GST-tagged abLIM-1, at baseline (BL) and with GSK-3β pre-treatment (GSK) obtained by mass spectrometry. n values are as follows: IgG=5, BL=4, GSK-3β =5. P-values were calculated via one-way ANOVA and Tukey’s multiple comparison test (F) Representative western blot of abLIM-1 and total protein stain in scrambled and abLIM-1 EHTS (G) Quantification of abLIM-1/total protein, normalized to scrambled (n=5, p=0.032). P-value was calculated by Mann-Whitney test. (H) Cross-sectional area of scrambled and abLIM-1 EHTs. P-value was calculated via unpaired Mann-Whitney test (I) Twitch forces in EHTs treated with either scrambled (blue) or abLIM-1 (red) siRNA. Twitch forces were measured at 72 steps between a -10% (of total EHT length) slack to +10% stretch. Twitch forces are normalized to 0% stretch. (n values: Scrambled =6, abLIM-1= 7). p =0.0043 refers to the difference between groups at 10% stretch, calculated by unpaired t-test (J) Representative traces of force (μN) at 0% (light blue = scrambled, orange = abLIM-1) and 10% (dark blue = scrambled, red = abLIM-1) stretch in a scrambled and abLIM-1 siRNA treated EHT.