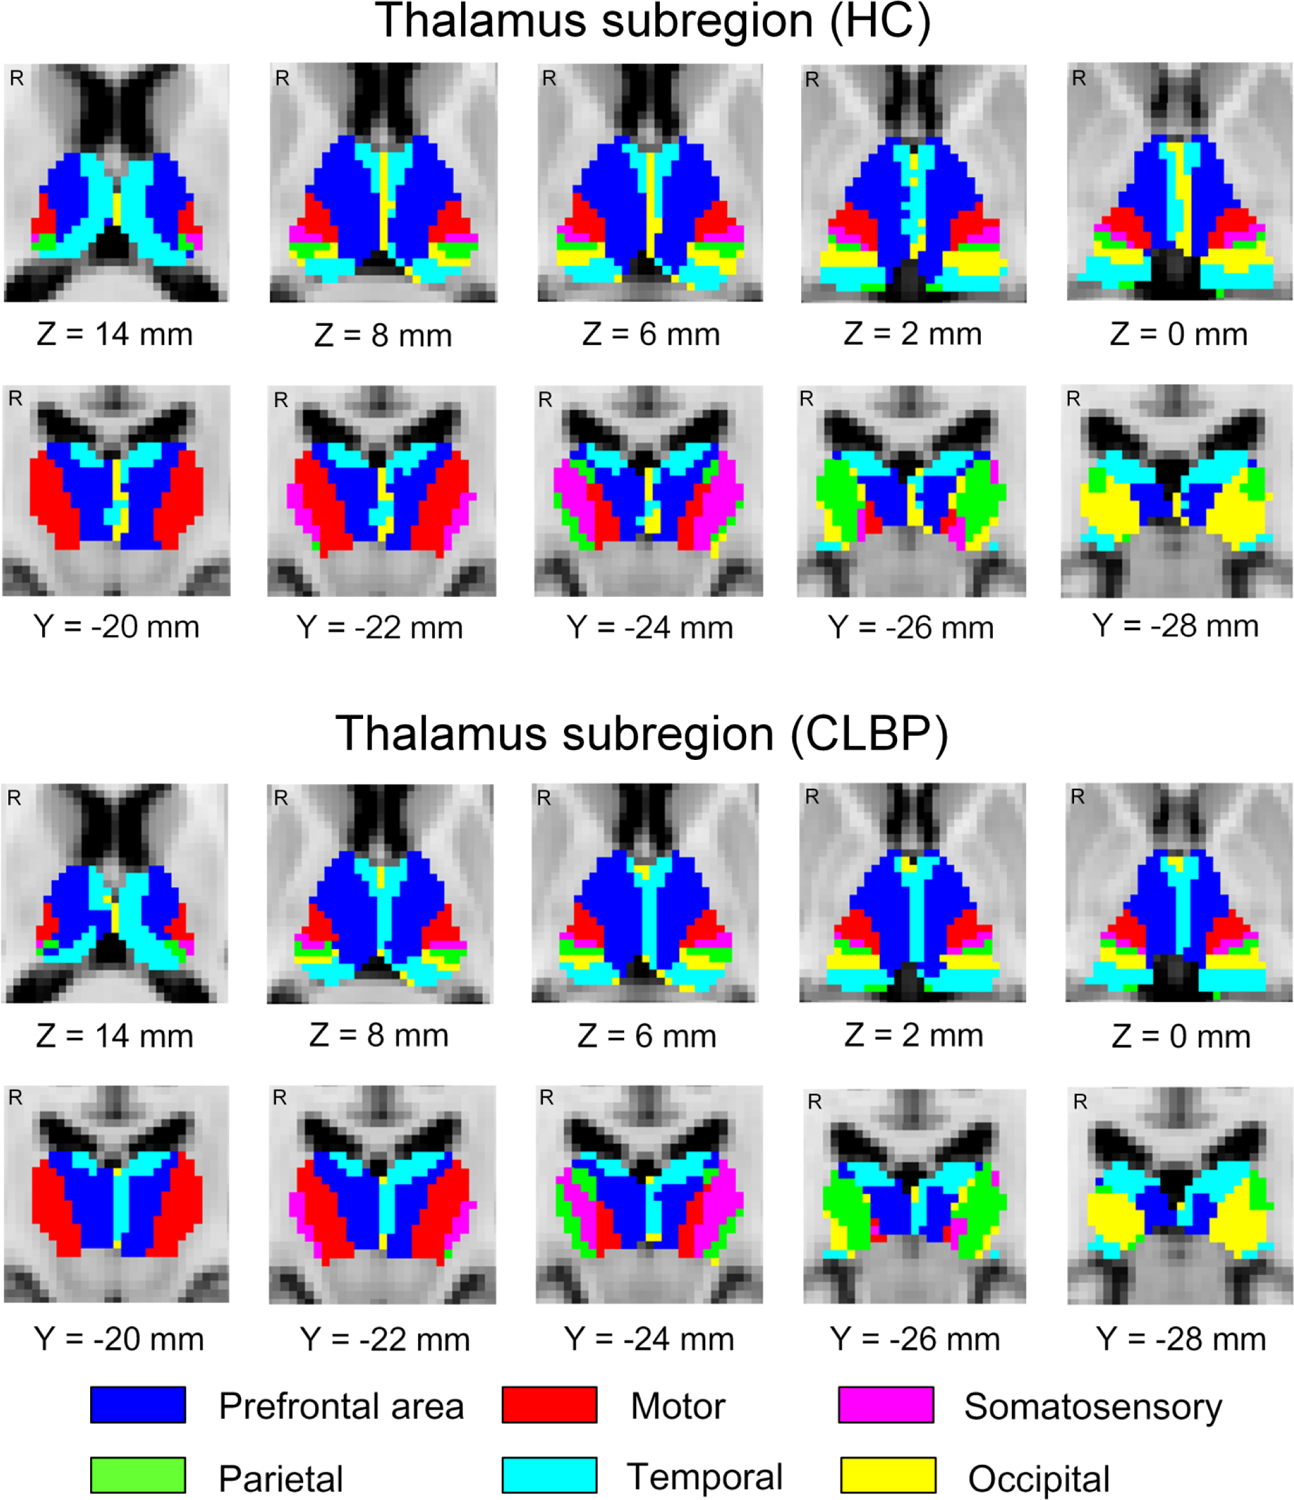
Figure 1. Thalamus subregions characterized by DTI.

The thalamus subregions in 54 healthy controls (a) and 54 patients with chronic low back pain revealed by probabilistic tractography are shown. Each color represents one thalamic subregion corresponding to its cortical region of interest. HC, healthy controls; CLBP, chronic low back pain; R, right; mm, millimeter. “Z” and “Y” are Montreal Neurological Institute coordinates, representing axial and coronal views, respectively.
