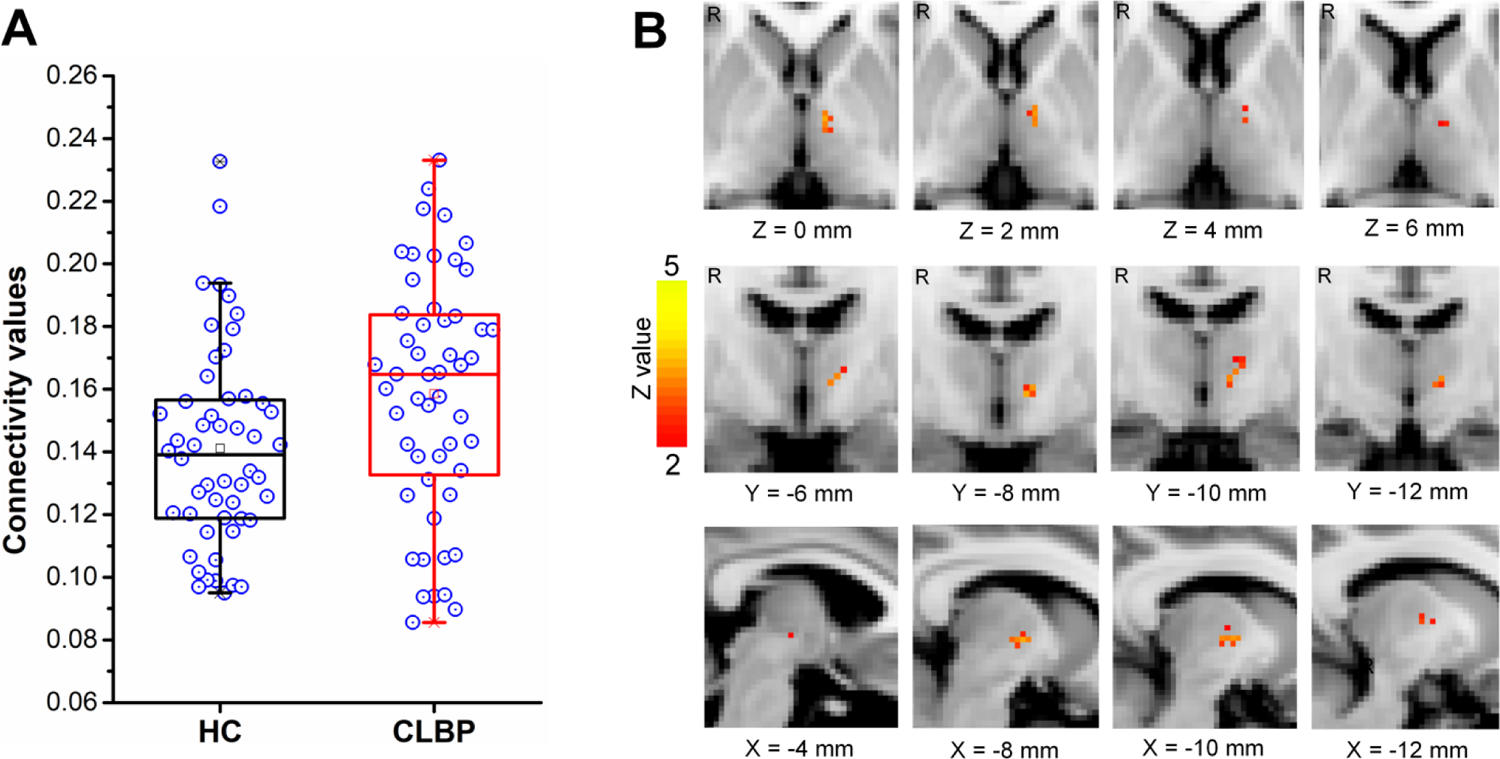
Figure 3. Anatomical connectivity of the thalamo-motor pathway.

(A) Box-and-whisker plot showing the anatomic connectivity values of the left thalamo-motor pathway in healthy controls and patients with chronic low back pain. The open circles indicate the anatomical connectivity strengths of the left thalamo-motor pathway in both groups. The upper and lower edges of the box mark the 25th and 75th percentiles. The error bars represent the 95% confidence level. (B) Group differences of the anatomical connectivity in the left thalamo-motor pathway revealed by cluster-wised diffusion tensor imaging tractography. HC, healthy controls; CLBP, chronic low back pain; R, right. mm, millimeter; “X”, “Y”, and “Z” are Montreal Neurological Institute (MNI) coordinates, representing sagittal, coronal and axial views, respectively.
