
Figure 4. Resting-state functional connectivity of thalamocortical pathways.
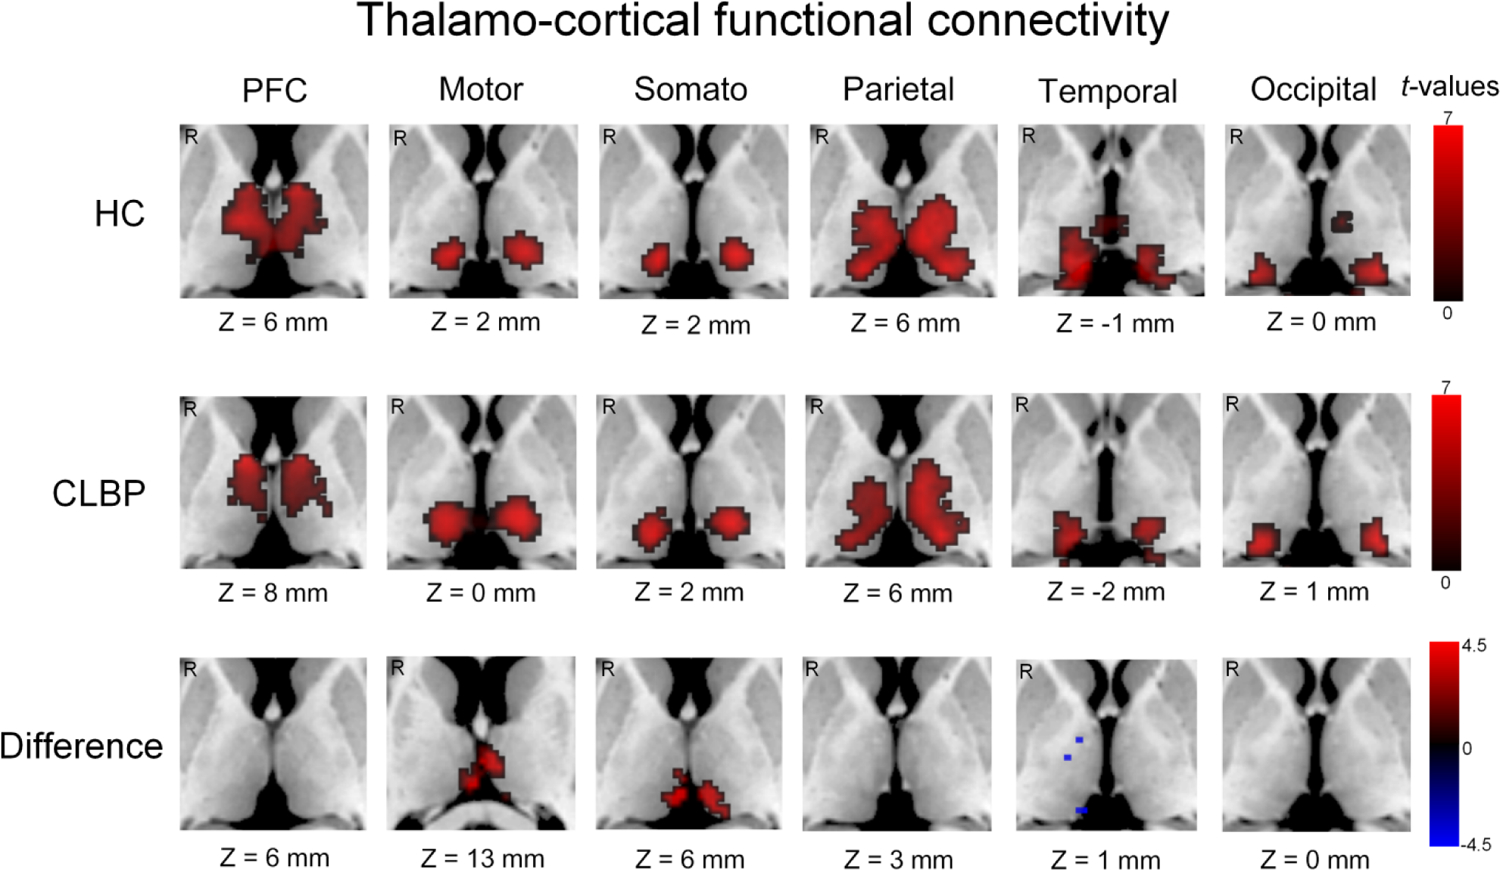
Clusters in the first two rows were displayed only if they were larger than 50 voxels. The third row represents the group difference between patients with chronic low back pain and healthy controls. HC, healthy controls; CLBP, chronic low back pain; PFC, prefrontal cortex; somato, somatosensory cortex; mm, millimeter; R, right. “Z” represents Montreal Neurological Institute (MNI) coordinates, representing axial view.