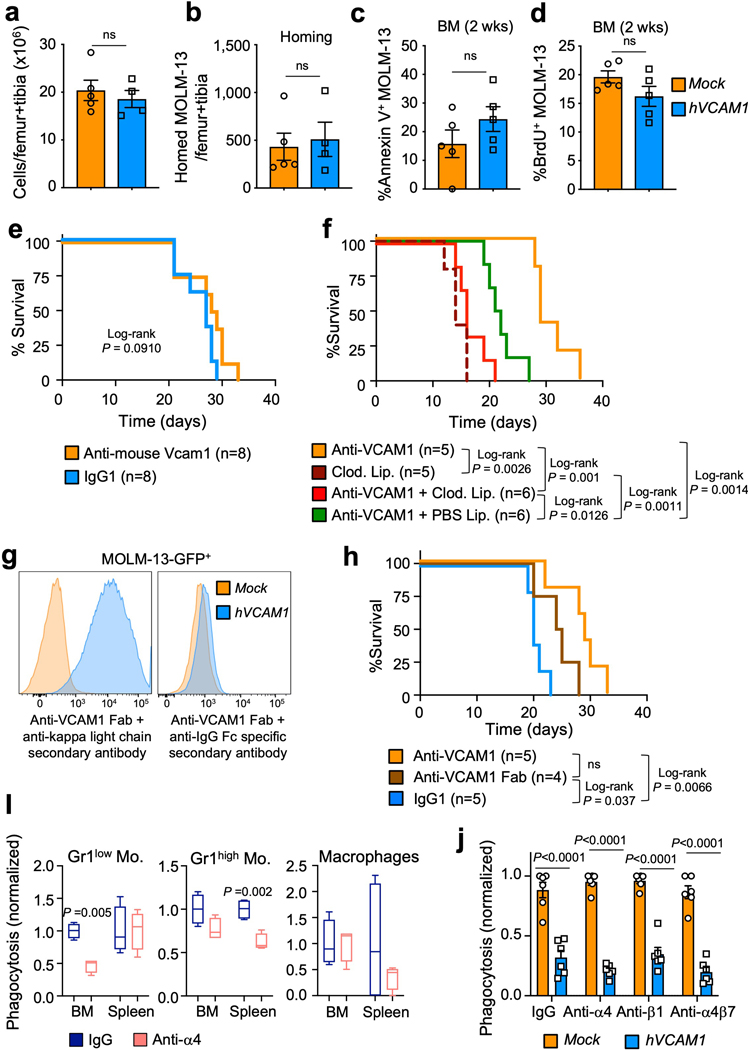
Extended Data Fig. 9. Mechanisms of VCAM1 antibody inhibition in leukemogenesis.
(a) BM cellularity and (b) number of MOLM-13 cells that homed to the BM of recipient mice (n=5 Mock, n=4 hVCAM1 biological replicates). (c) Percentage of Annexin V+ apoptotic (n=5 biological replicates) and (d) proliferating BrdU+ MOLM-13 cells in the BM of recipients (n=5 biological replicates). (e) Survival analysis of mice with established MOLM-13 AML (>1% peripheral human CD45+ cells) and treated with daily injections (for 10 days) of IgG1 and anti-mouse Vcam1 monoclonal antibody which does not cross-react with human VCAM1. (f) Survival analysis of mice with established hVCAM1-MOLM-13 AML (>1% peripheral human CD45+) treated with daily injections (10 days) of anti-human VCAM1 monoclonal antibody or with PBS or clodronate liposomes. (g) Human Mock- and hVCAM1-MOLM-13 cells incubated with anti-human VCAM1 Fab fragments and with secondary antibodies specific against mouse IgG kappa light chain (left) or against mouse IgG Fc portion. (h) Survival analysis of mice with established hVCAM1-MOLM-13 AML and treated with anti-human VCAM1 monoclonal antibody, anti-human VCAM1 Fab fragments or with IgG1 for 5 days. (i) In vivo phagocytosis assay testing the effect of integrin alpha 4 blocking antibody in the clearance of transplanted haplotype-mismatched cells (n=4 biological replicates). (j) In vitro phagocytosis of Mock-MOLM-13 and hVCAM1-MOLM13 cells, in the presence of anti-alpha4, anti-beta1, anti-alpha4-beta7 blocking antibodies, compared with IgG. Values were normalized to the maximum number of events measured across technical replicates (n=6). Error bars, mean ± s.e.m. Box plots: media, whiskers: minimum and maximum. Unpaired two-tailed student’s t test (a-d, i). Log-rank analysis was used for the Kaplan-Meier survival curves in (e, f, h). Two-way ANOVA with multiple comparisons correction (j). ns, non-significant. Significant P values are indicated in the figure.

