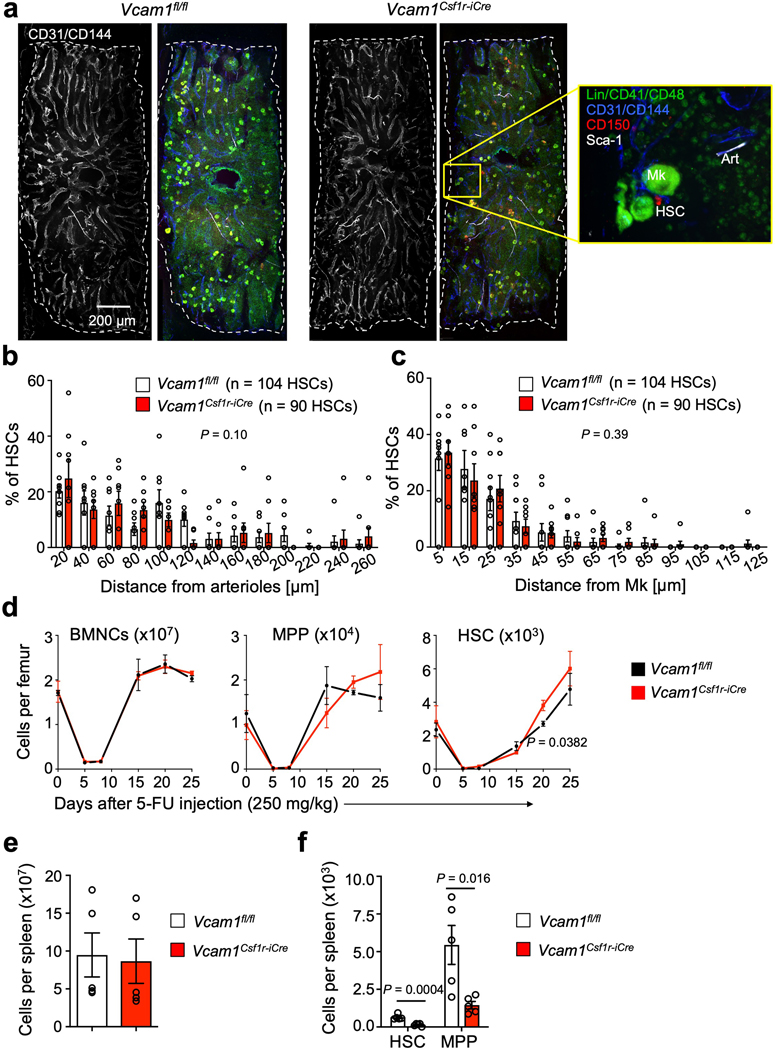
Extended Data Fig. 3. The distribution of HSCs in the mouse BM is not altered after Vcam1 deletion in Csf1r-iCre+ cells.
(a) Representative whole-mount images of the sternal BM of Control and Vcam1Csf1r-iCre mice and magnified high power view. The dashed outline denotes bone-BM border. Arterioles (Art) are identified by CD31+ CD144+ Sca1+ expression. Phenotypic HSCs are identified by Lineage- CD41- CD48- CD150+ expression, and megakaryocytes (Mk) are distinguished by their size, morphology and CD41+ CD150+ expression. Representative images of n=8 independent sternum segments (b, c) Localization of HSCs relative to (b) arterioles and (c) Mks in Vcam1fl/fl and Vcam1Csf1r-iCre mice. (n=104 HSCs in Vcam1fl/fl, n=90 HSCs in Vcam1Csf1r-iCre) (d) Number of BMNCs, MPP and HSC per femur in Vcam1fl/fl and Vcam1Csf1r-iCre mice after 5-FU injection (Vcam1fl/fl day 0 n=5, day 5 n=2, day 8–20 n=3, day 25 n=4; Vcam1Csf1r-iCre day 0 n=5, day 5–15 n=2, day 20–25 n=4 biological replicates). (e) Spleen cellularity, and (f) number of HSCs and MPPs per spleen in Vcam1fl/fl and Vcam1Csf1r-iCre mice (n=5 biological replicates). Error bars, mean ± s.e.m. Two-sample Kolmogorov–Smirnov tests were used for comparisons of distribution patterns in (b) and (c). Unpaired two-tailed student’s t test (d,e,f). Significant P values are indicated in the figure.

