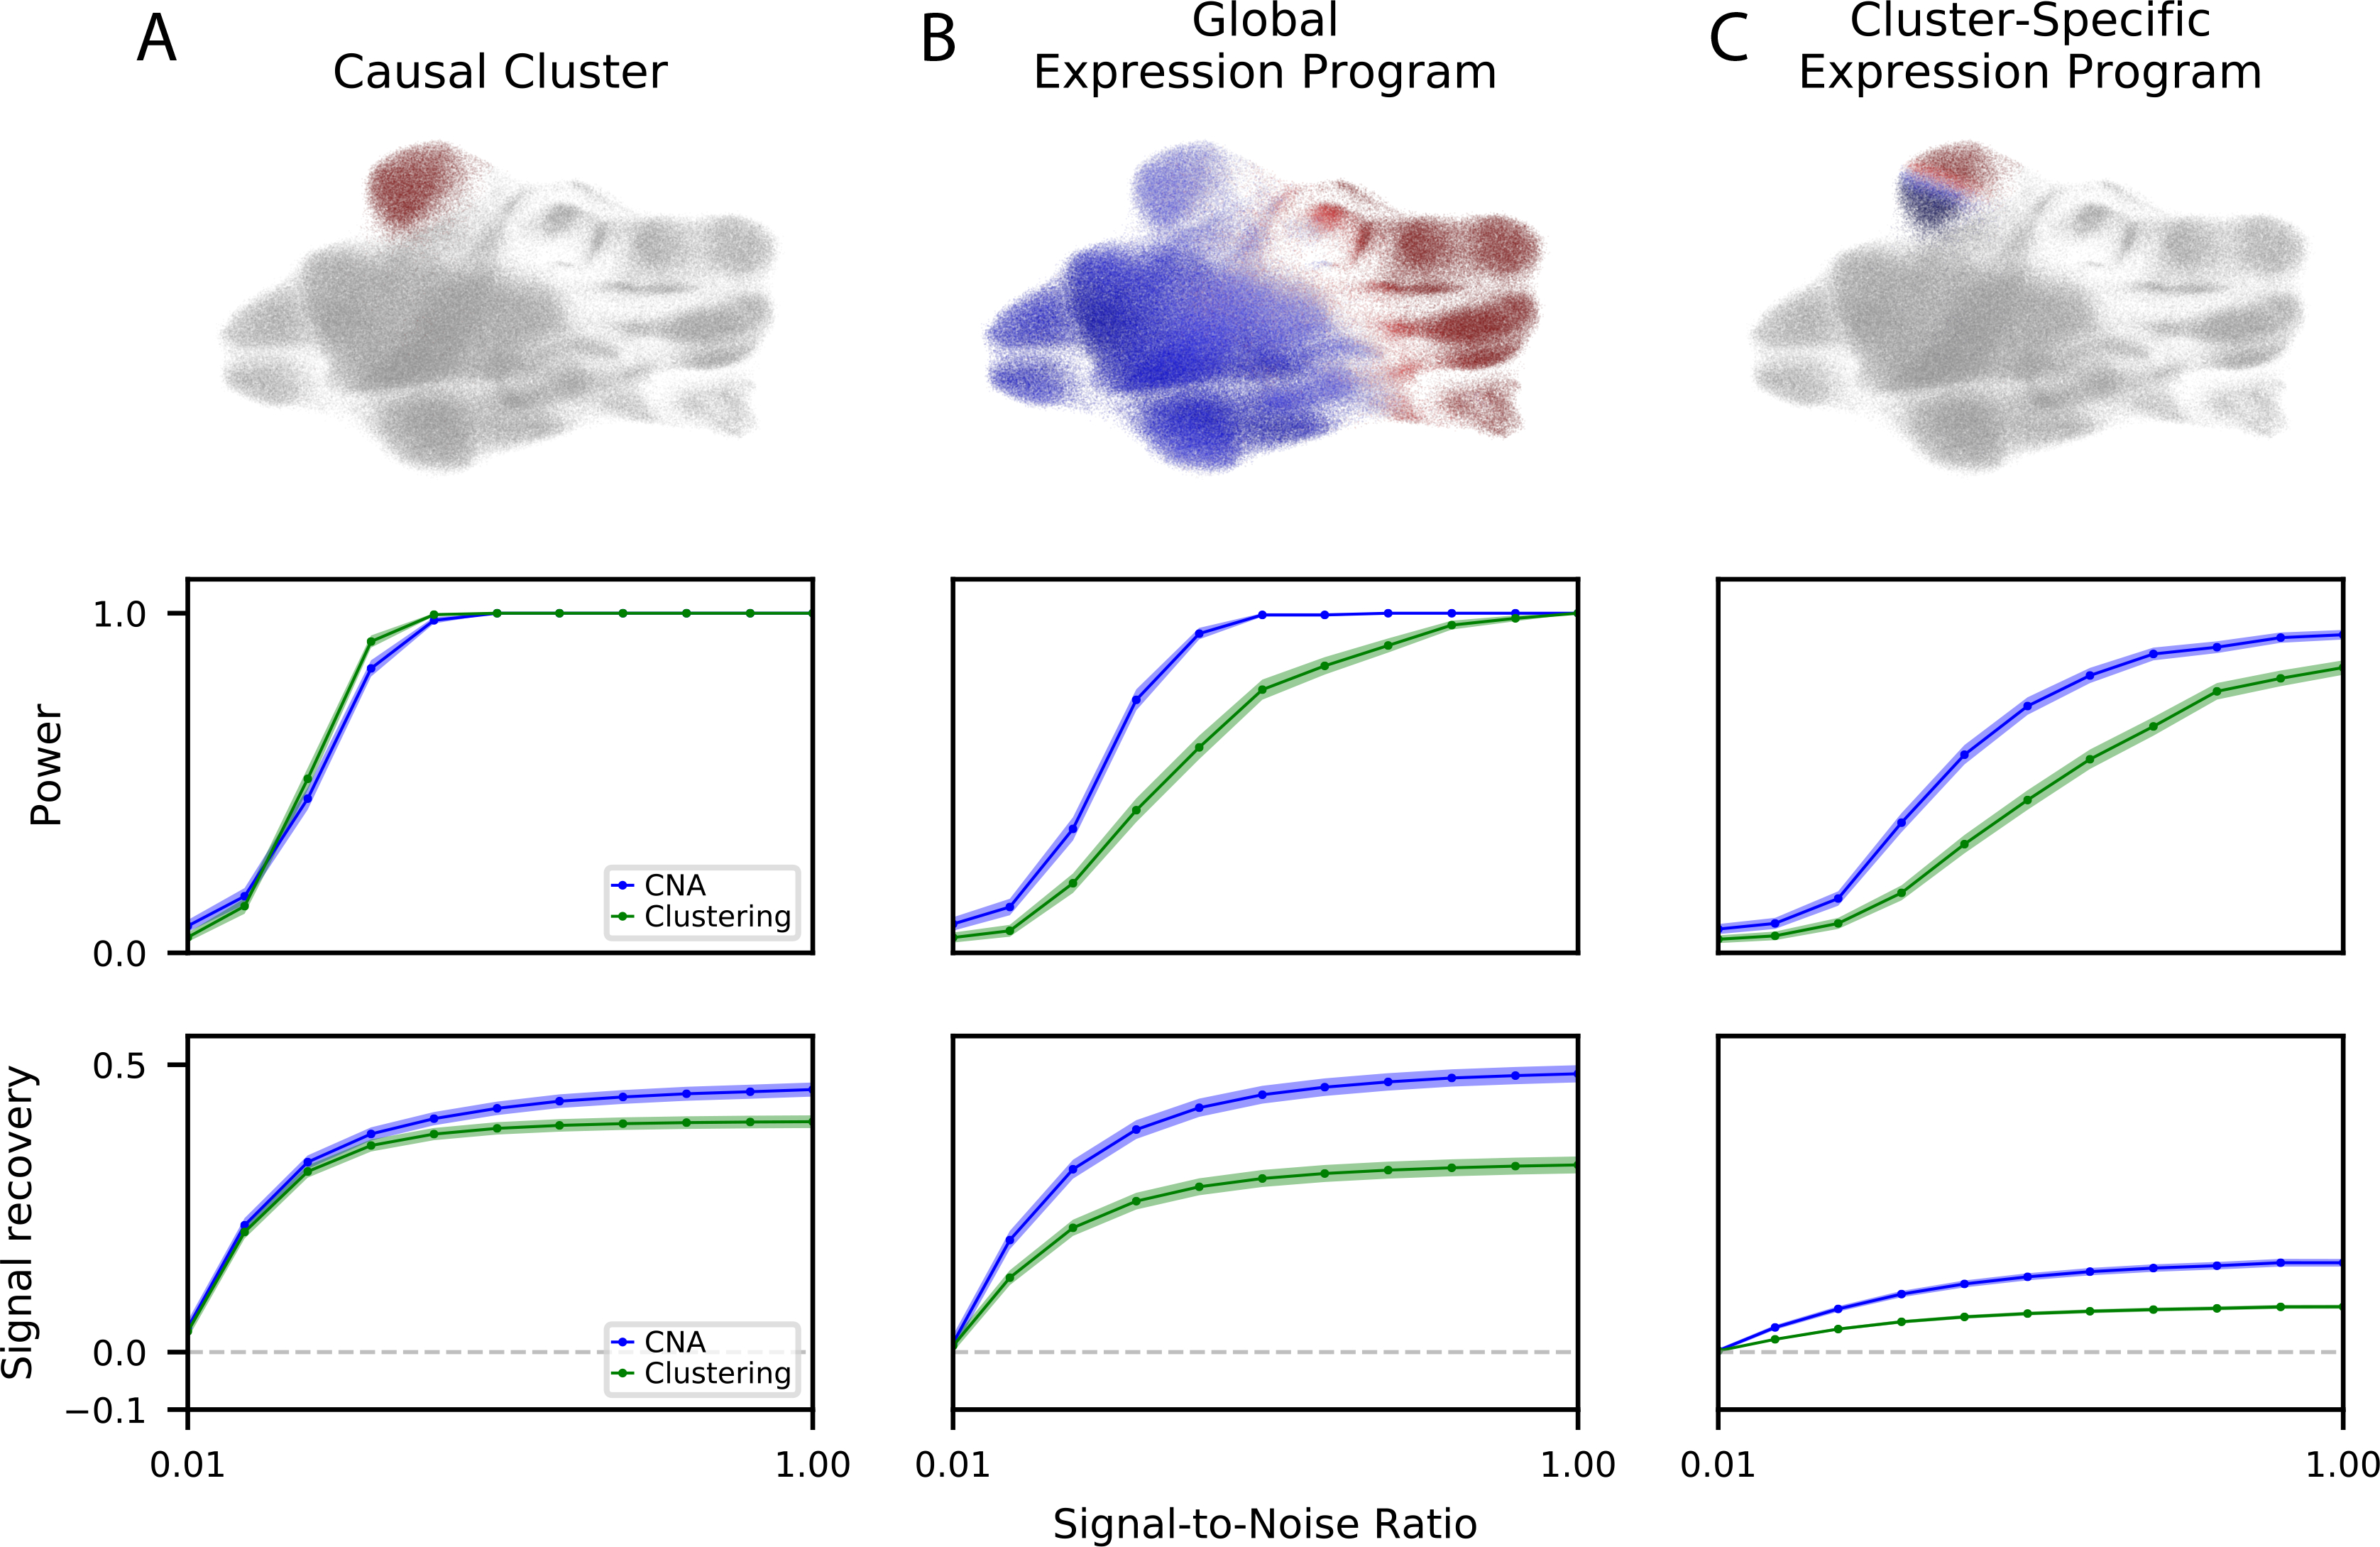
Figure 2: Power and signal recovery assessed in simulation.

We simulated three ground truth signal types: (A) causal clusters, (B) global gene expression programs, and (C) cluster-specific gene expression programs. For each signal type, we show (top) an example of the signal in UMAP space indicating the contribution of each cell to its respective sample’s attribute value. with warmer colors indicating a positive contribution, cooler colors indicating a negative association, and grey indicating neutral contribution, (middle) the power of CNA versus a cluster-based approach (MASC) across a range of signal-to-noise ratios at ɑ = 0.05, and (bottom) the signal recovery of CNA versus a cluster-based approach across a range of signal-to-noise ratios. For power and signal recovery, we plot the mean across all simulations at the given signal-to-noise ratio, as well as the standard error around the mean.
