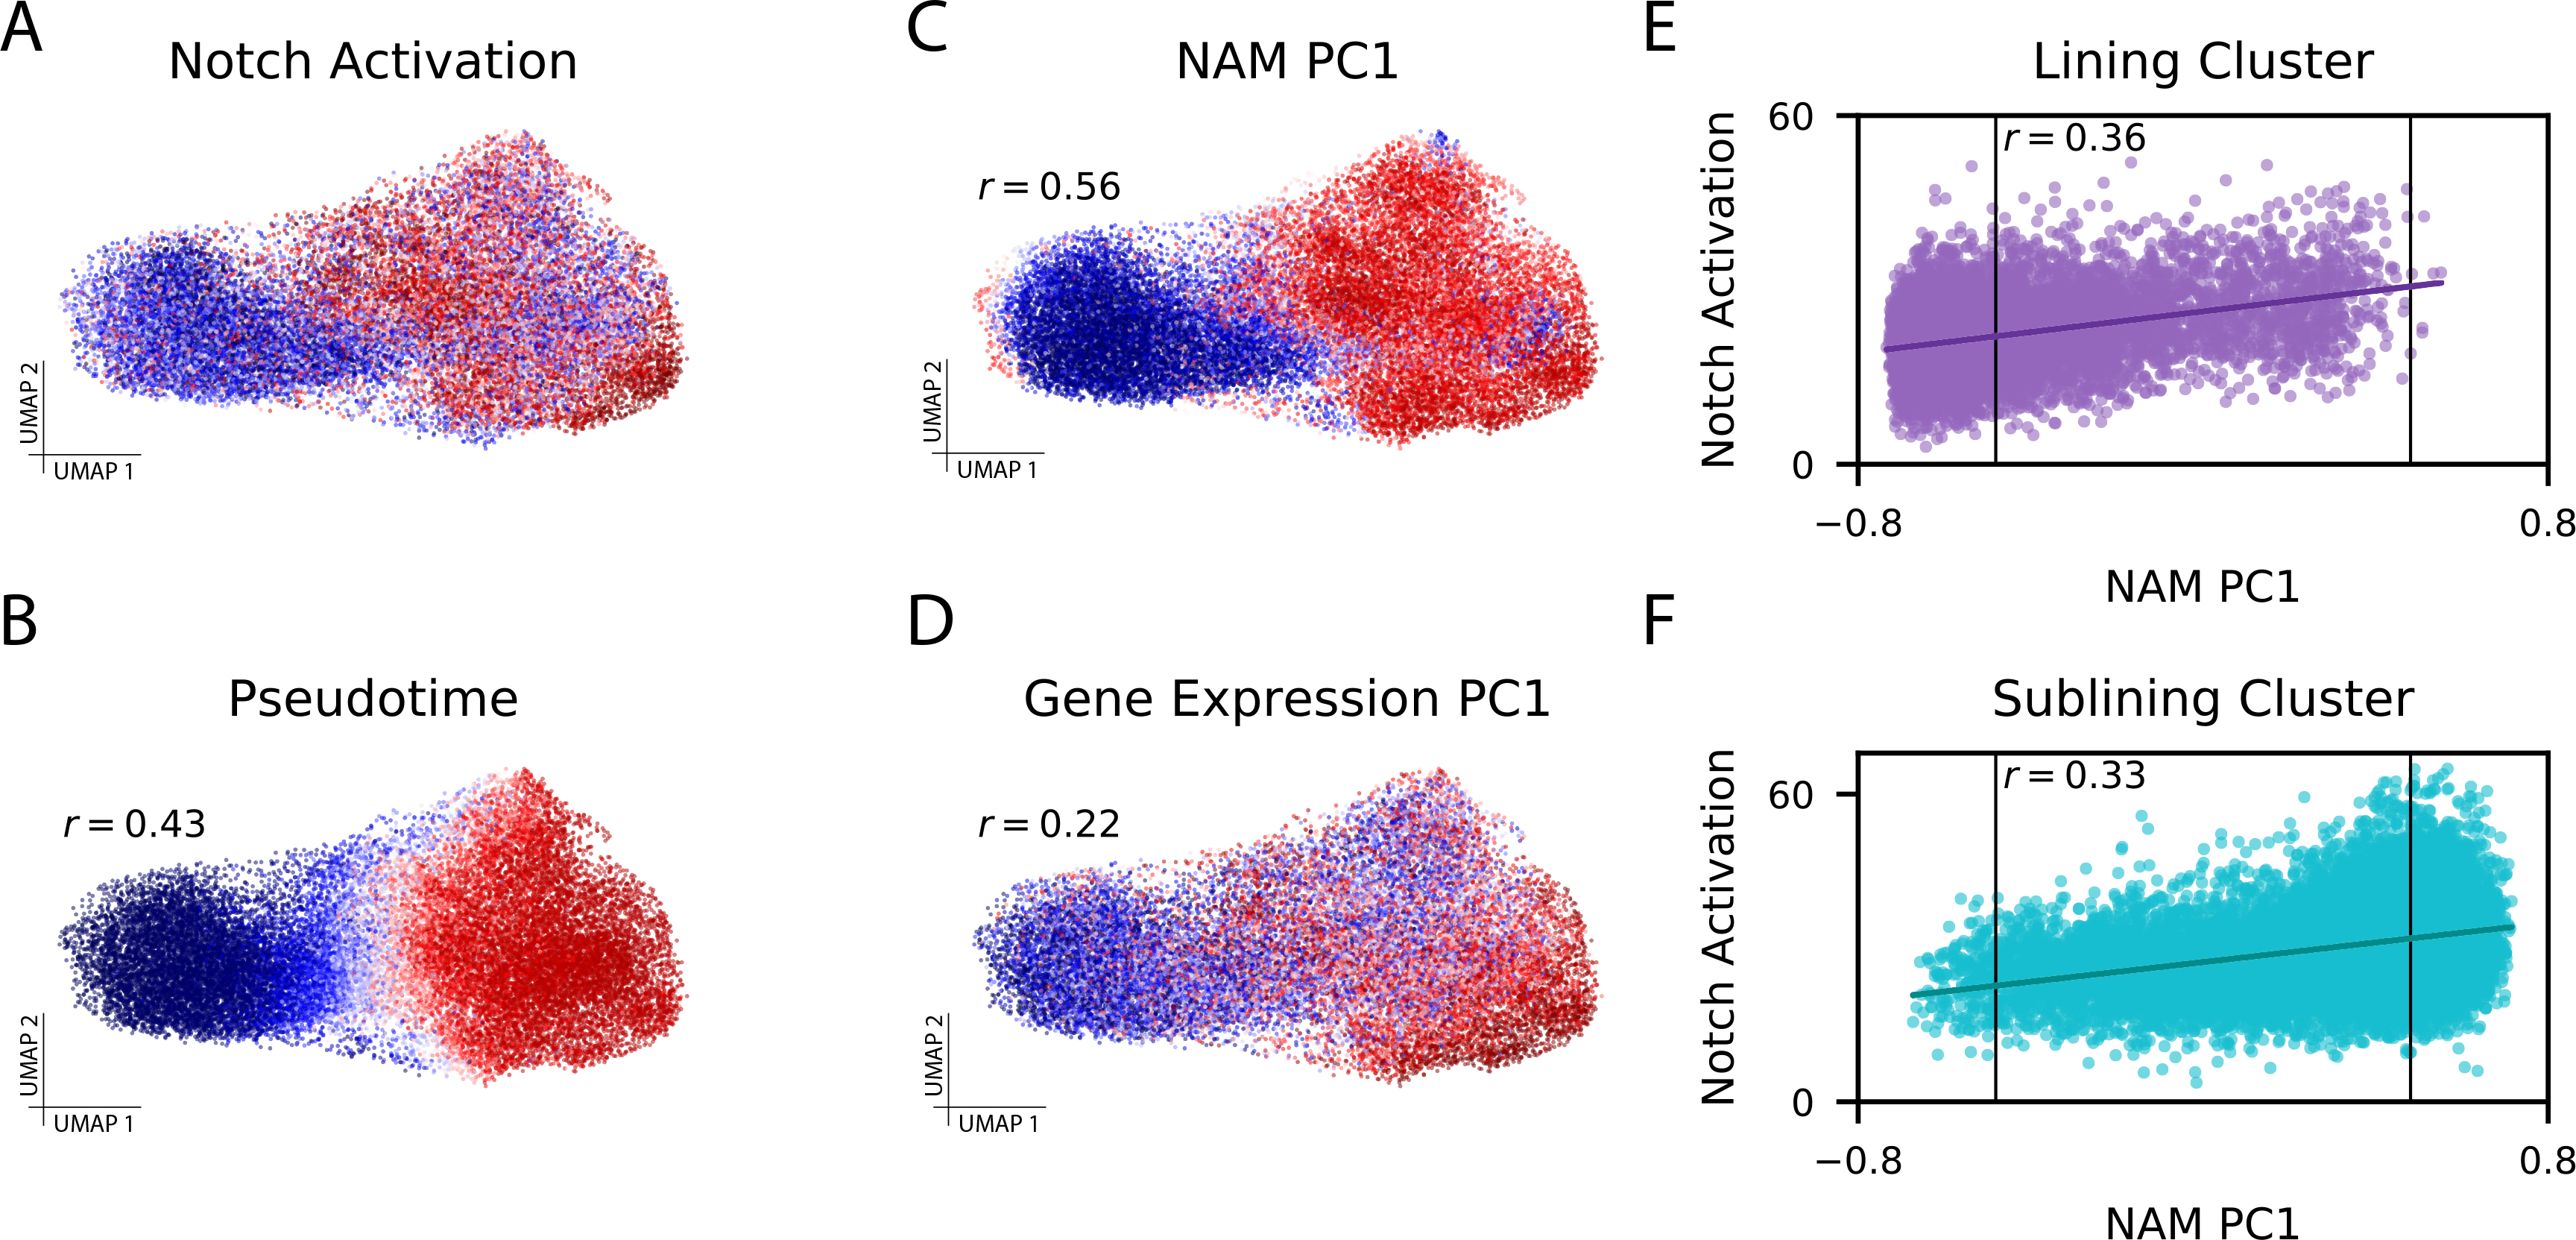
Figure 3: CNA captures Notch activation gradient in rheumatoid arthritis dataset.

(A) Experimentally-determined Notch activation score per fibroblast cell. (B) Pseudotime assignments per cell (Spearman r=0.43 to Notch activation score). (C) The loading on NAM-PC1 for each cell’s anchored neighborhood (Spearman r=0.56 to Notch activation score). (D) Cell loadings on PC1 of the gene expression matrix (Spearman r=0.22 to Notch activation score). (E) Notch activation score per cell assigned to the lining cluster and (F) Notch activation score per cell assigned to the sublining cluster, each plotted against the anchored neighborhood’s loading on NAM-PC1. The FDR<0.05 thresholds beyond which each neighborhood was considered expanded in RA (right) or depleted in RA (left) are marked with vertical lines on (E) and (F), highlighting that some cells from each cluster are included in the expanded population and the depleted population.
