
Figure 4: CNA refines sepsis-associated blood cell populations.
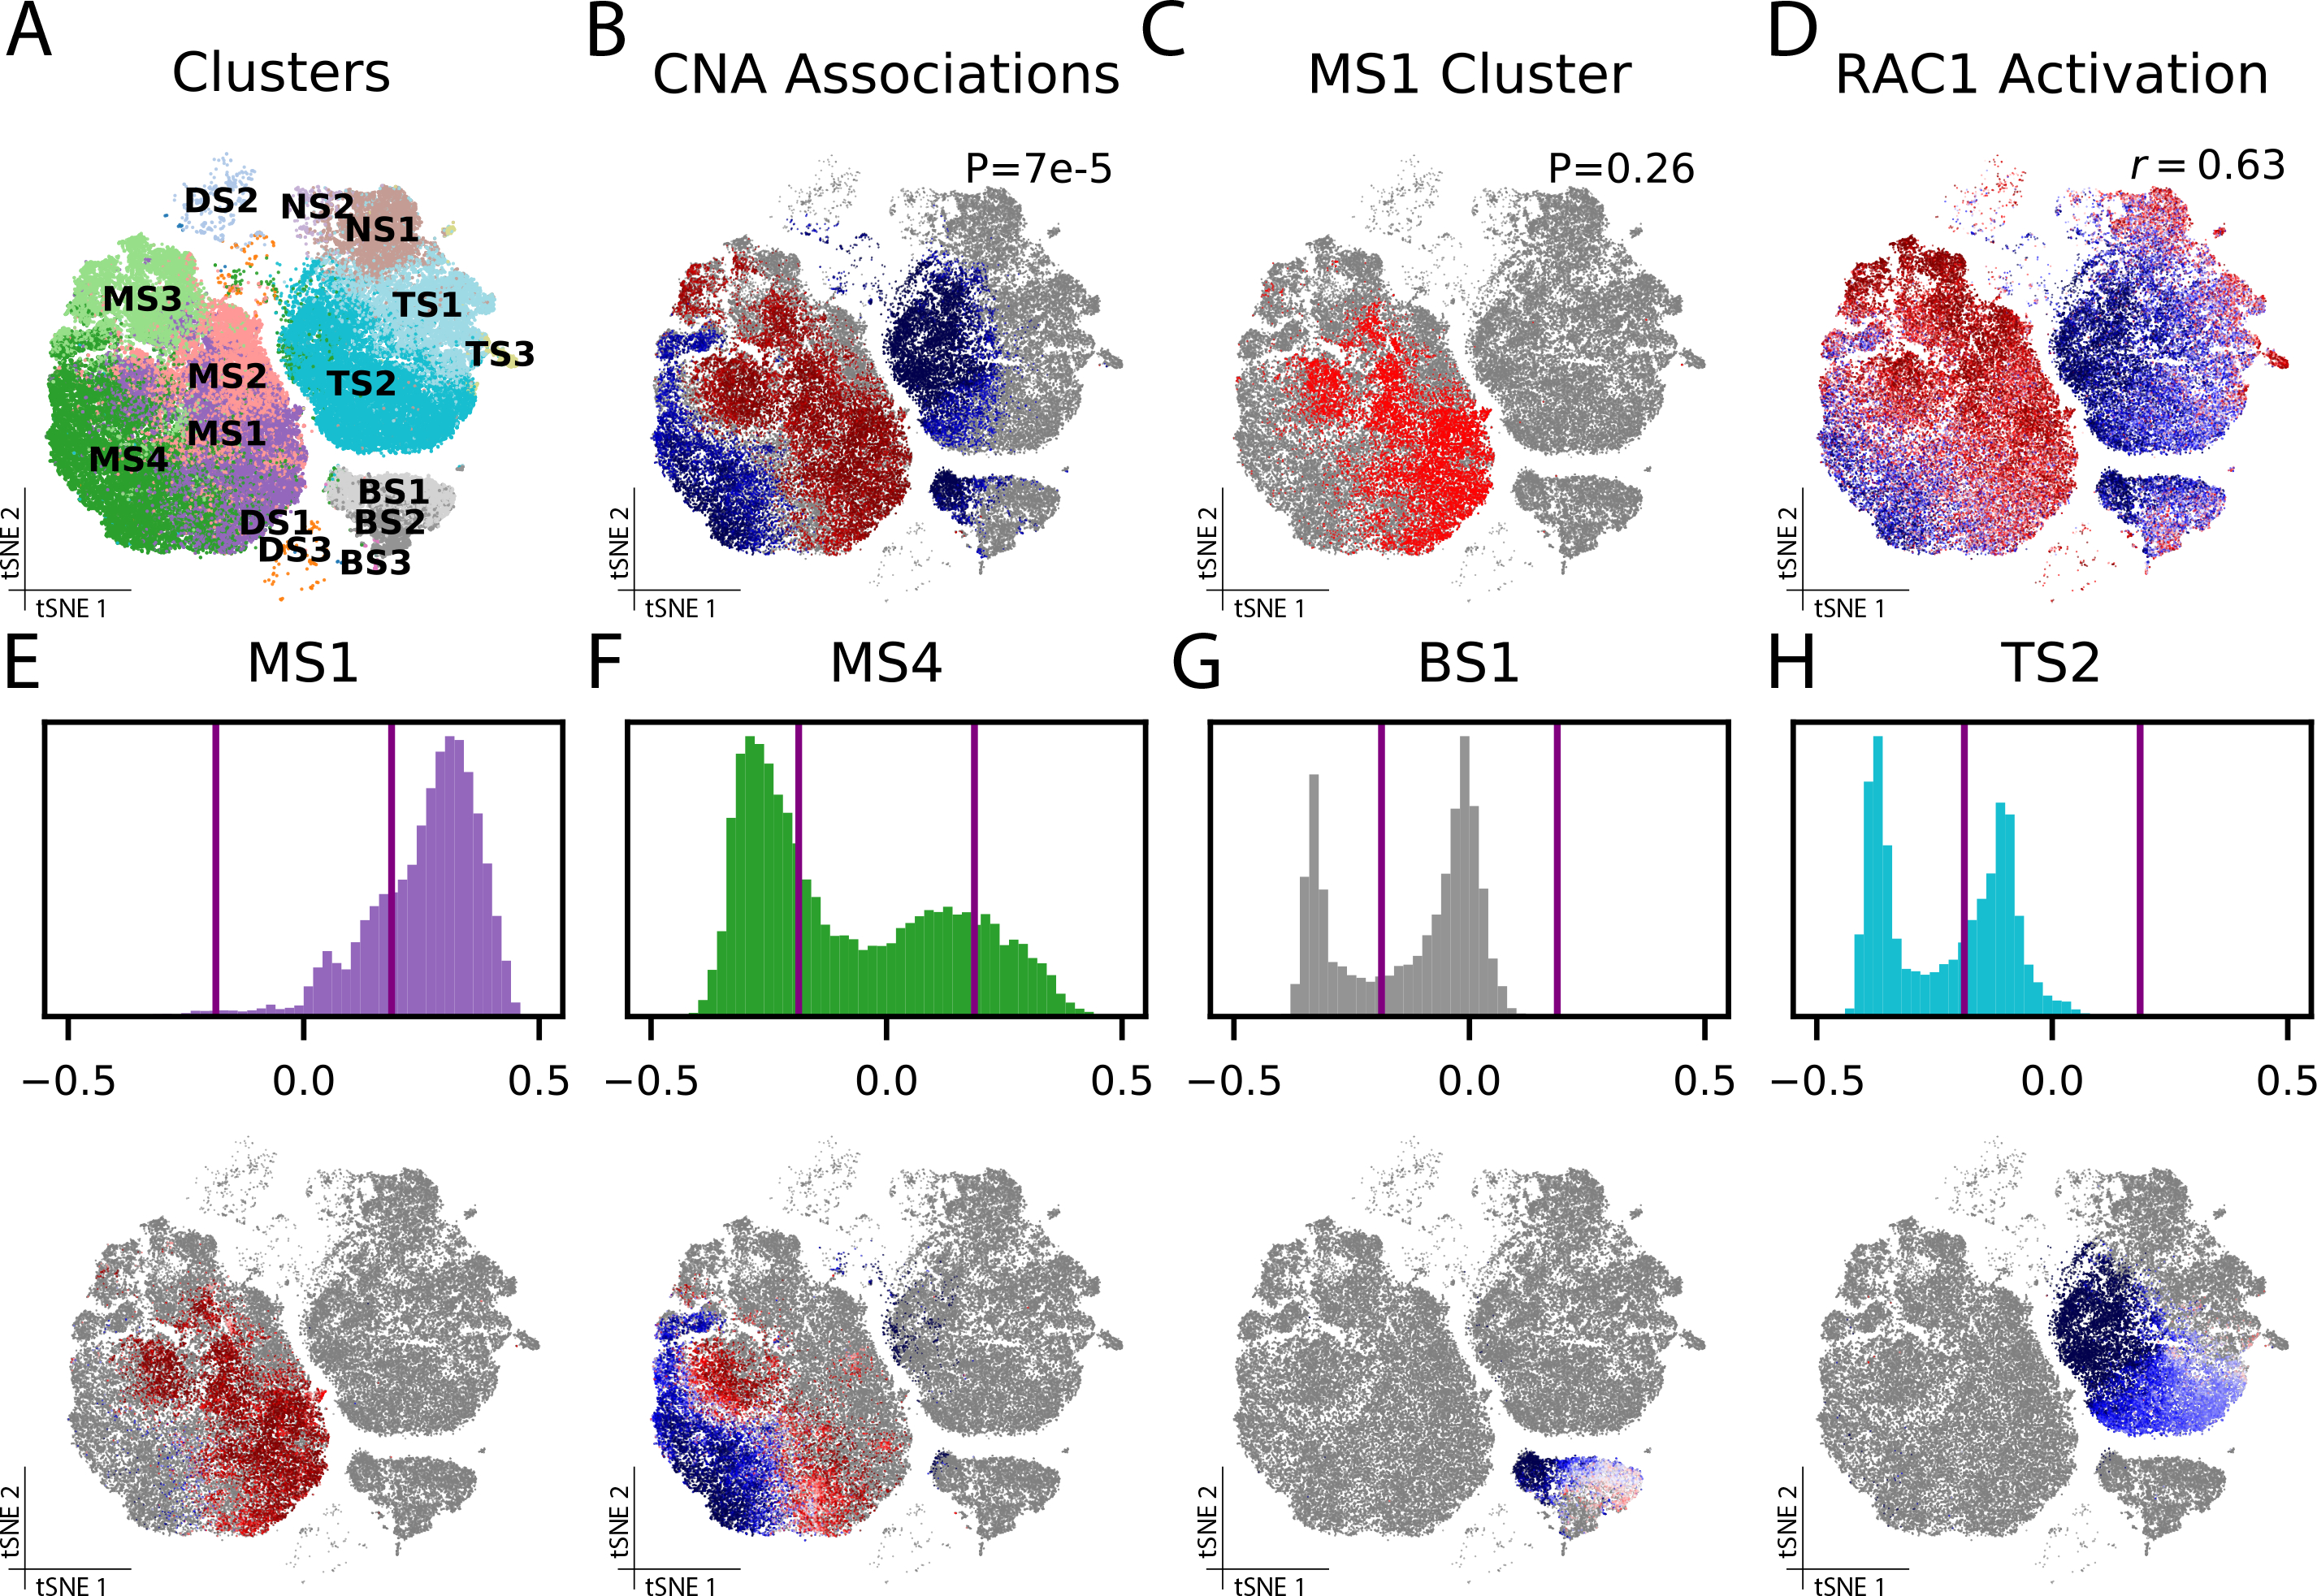
(A) Clusters from the published analysis. (B) Results of association test for sepsis across the whole cohort using CNA (CNA global p=7e-5): each cell is colored according to its neighborhood coefficient, with red indicating high correlation and blue indicating low correlation. (C) MS1, the cluster closest to approaching nominal significance (MASC p=0.26) in a cluster-based association test for sepsis across the whole cohort. (D) Cells colored according to their summed expression of genes in the RAC1 activation gene set. (E-H) The distribution of neighborhood coefficients to sepsis phenotype within several of the original clusters—MS1 (E), MS4 (F), BS1 (G) and TS2 (H)—are shown as histograms (top) and in tSNE space (bottom).