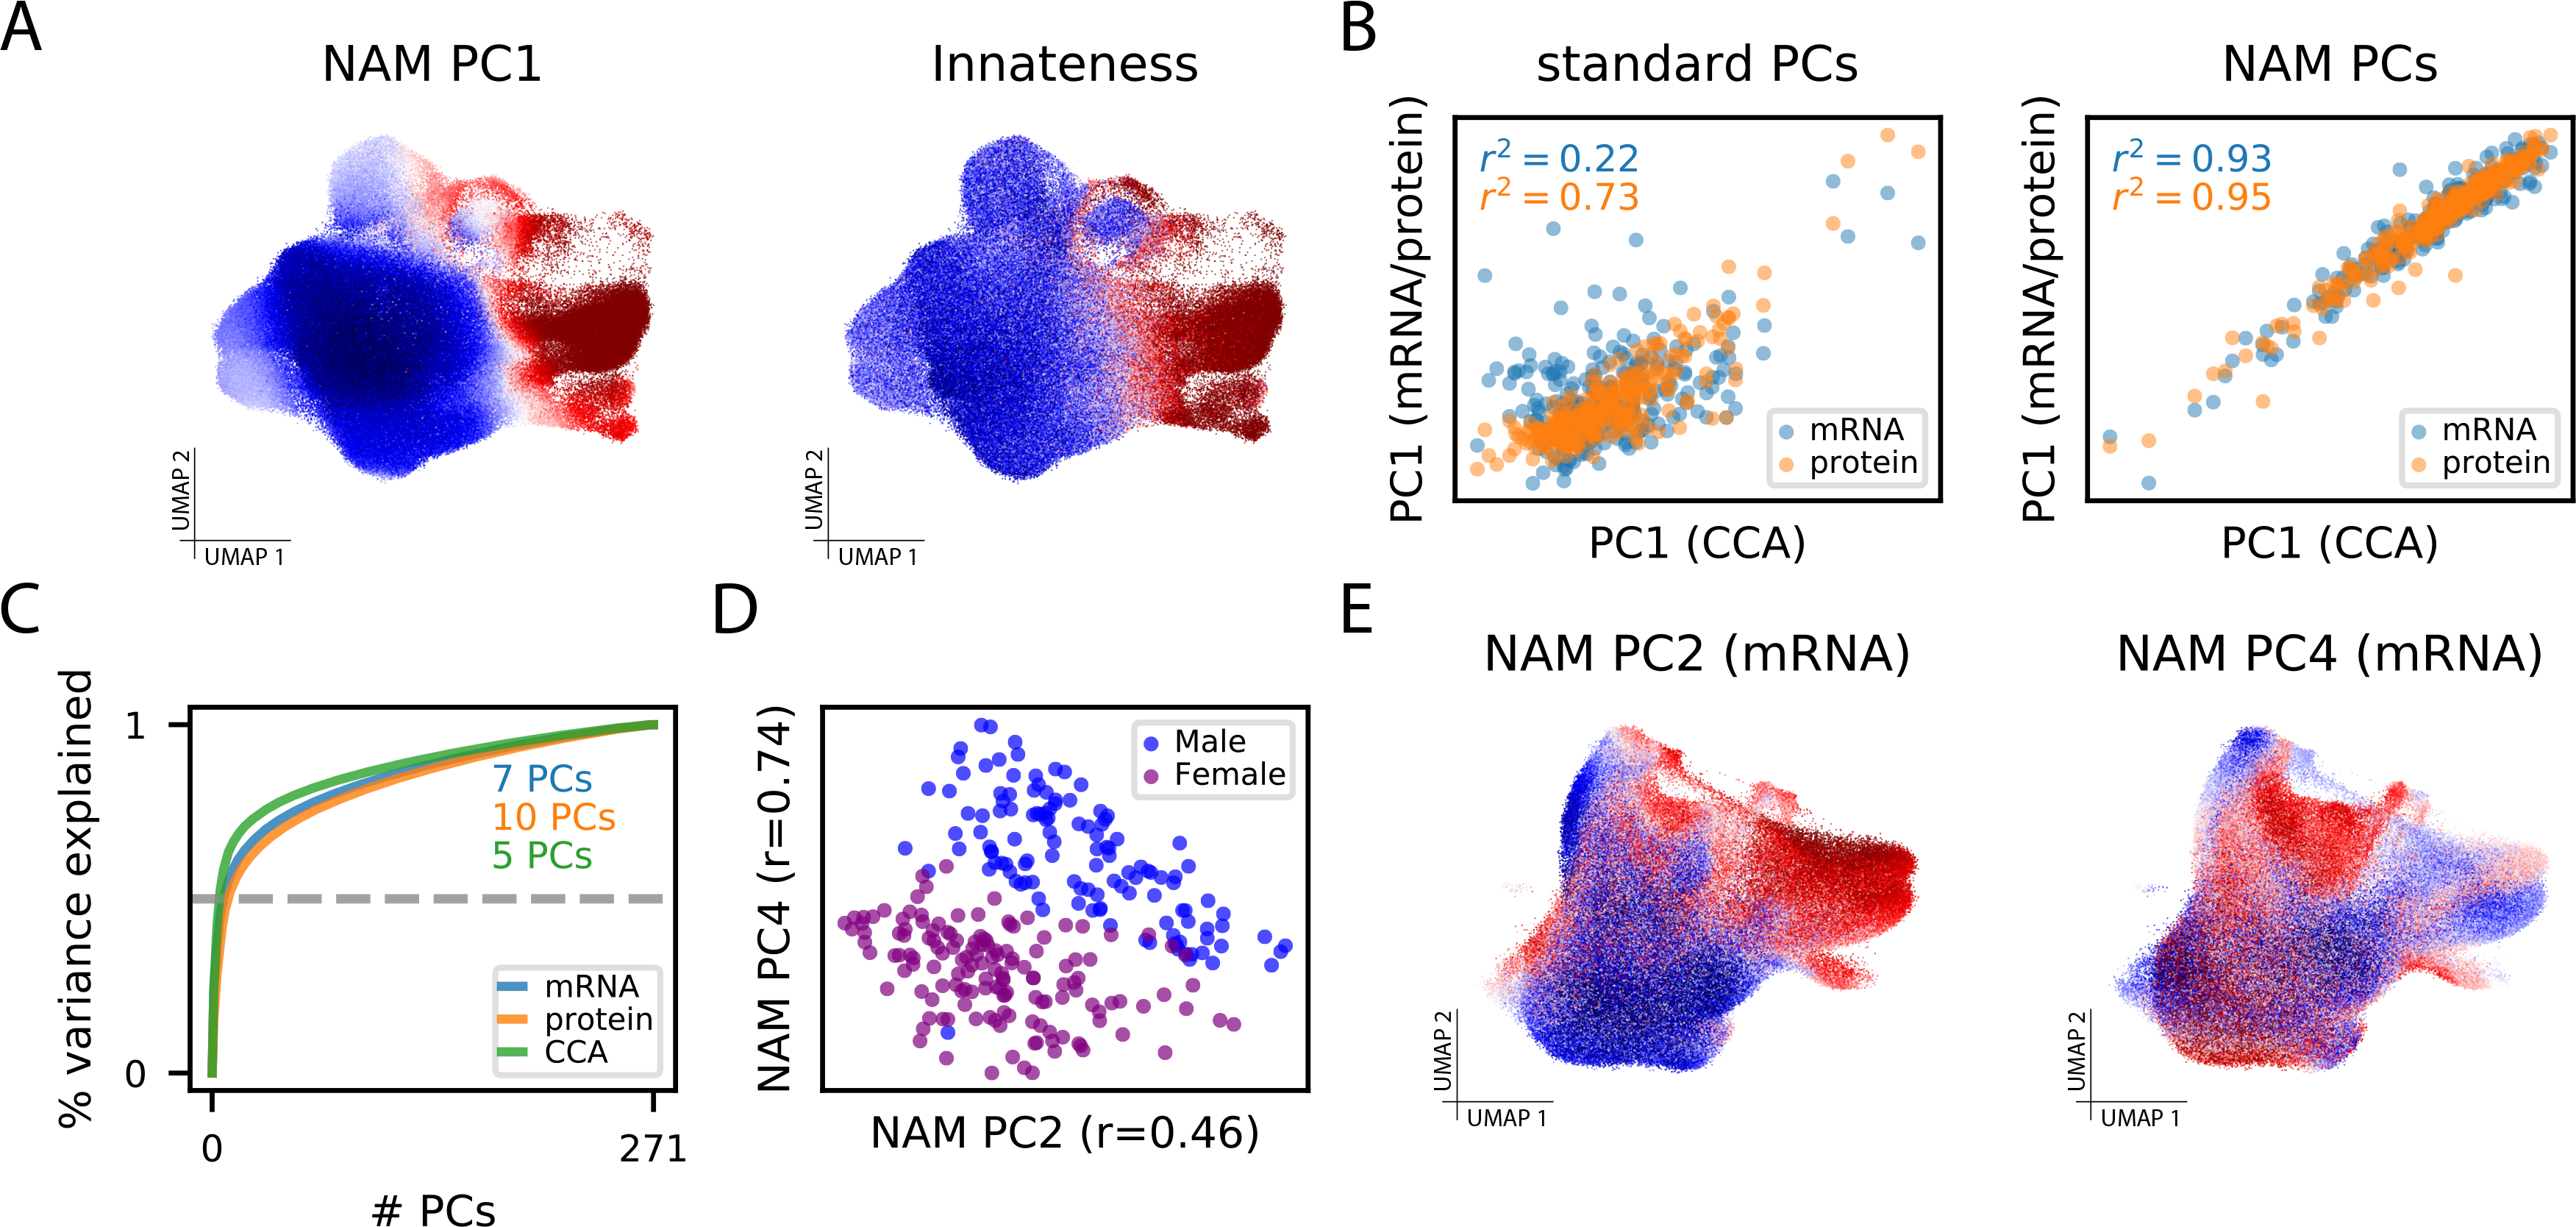
Figure 5: CNA characterizes biologically meaningful structure in TB dataset.

(A) UMAP with cells colored by their anchored neighborhood’s loading on NAM-PC1 (left) or the transcriptional score of innateness from Gutierrez-Arcelus, et al. (right)[24]. (B) (Left) Sample loadings along the first PCs resulting from naive PCA of mRNA expression and protein expression plotted against the same loadings for the CCA-based joint mRNA/protein representation. (Right) Sample loadings along the first PCs resulting from PCA of the NAM generated from mRNA expression and protein expression plotted against the same loadings for the CCA-based joint mRNA/protein representation. (C) The cumulative percent of variance in the NAM explained by the NAM-PCs in each data modality. The minimum number of NAM-PCs needed to capture 50% of variance in each modality are highlighted. (D) Plot of sample loadings on NAM-PC2 and -PC4 colored by biological sex. (E) UMAP with cells colored by their anchored neighborhood’s loading on NAM-PC2 (left) or NAM-PC4 (right).
