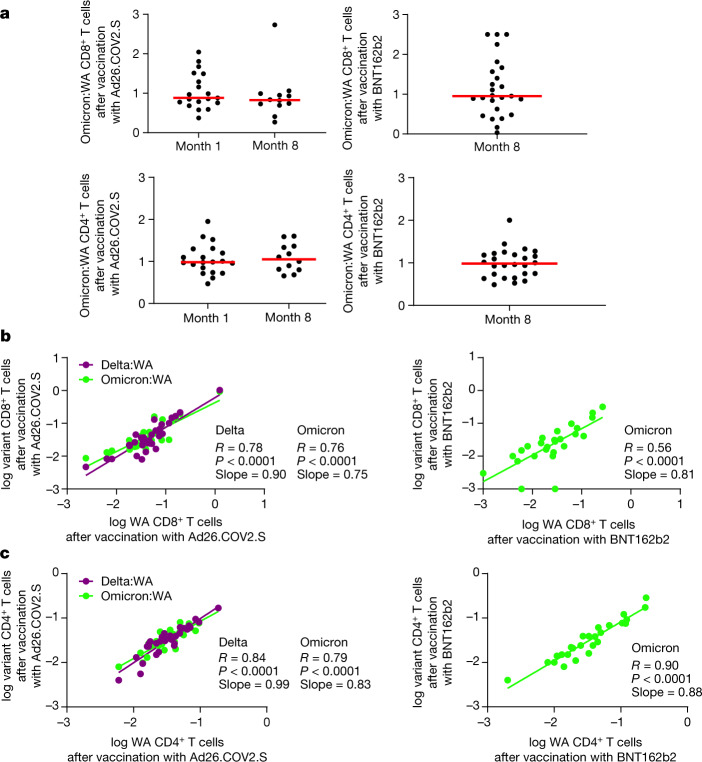
Fig. 3. Correlations of variant-specific and WA1/2020-specific cellular immune responses.
a, Ratio of Omicron to WA1/2020 CD8+ (top) and CD4+ (bottom) T cell responses in individual participants. b, c, Correlations of log Delta-specific and Omicron-specific to log WA1/2020-specific CD8+ T cell responses (b) and CD4+ T cell responses (c) by intracellular cytokine staining assays. Two-sided unadjusted P and R values for linear regression correlations are shown, and lines of best fit and slopes are depicted.

