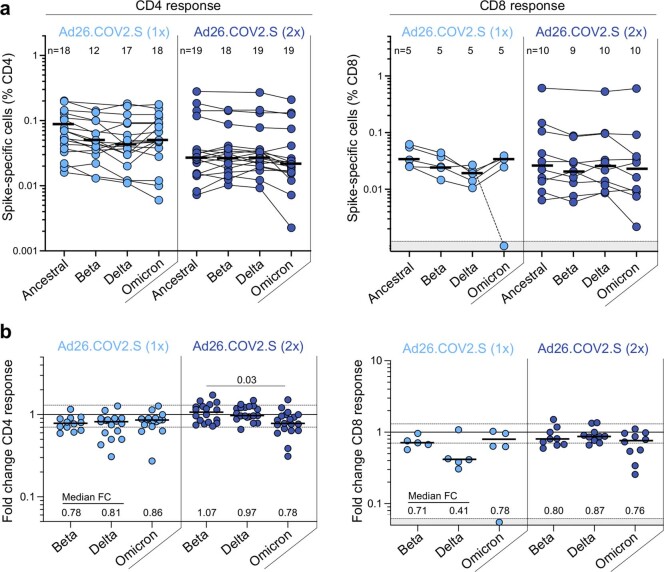
Extended Data Fig. 5. T cell responses to the ancestral, Beta, Delta and Omicron SARS-CoV-2 spike in participants who received Ad26.COV2.S (one or two doses).
a, Frequency of spike-specific CD4+ (left panel) and CD8+ T cells (right panel) producing any of the measured cytokines (IFN-γ, IL-2 or TNF-α) in response to ancestral, Beta, Delta and Omicron spike peptide pools. Bars represent median of responders. No significant differences were observed between variants using a Kruskal-Wallis test with Dunn´s multiple comparisons post-test. b, Fold change in the frequency of spike-specific CD4+ (left panel) and CD8+ T cells (right panel) between ancestral and Omicron spike responses. Bars represent medians. Differences between SARS-CoV-2 variants were calculated using a Kruskal-Wallis test with Dunn´s multiple comparisons post-test. Median fold changes are indicated at the bottom of each graph. The number of participants included in each analysis is indicated on the graphs.

