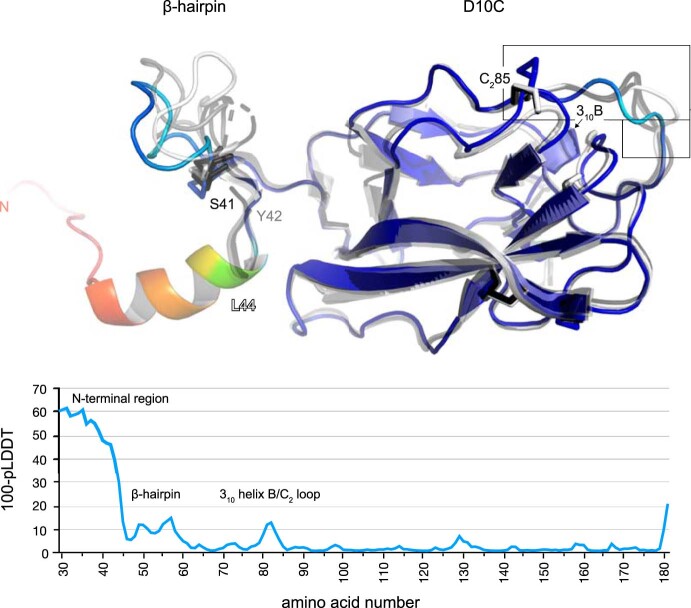
Extended Data Fig. 4. Comparison of the predicted and experimental structures of the human GP2 branch region.
The crystallographic models, shown as semi-transparent cartoons colored in black (P1), grey (P212121) and white (C2), are superimposed on the top AlphaFold2 model, colored from blue to red according to a 100-(per-residue confidence (pLDDT11)) scale that ranges from 0 (blue; maximum confidence) to 100 (red; minimum confidence). Note how the low-confidence prediction for the N-terminal region of the GP2 branch matches the observations that the corresponding residues are largely structurally disordered in the different crystal forms of the protein (whose first resolved residues, S41/Y42 (P1 chains A/B), Y42 (P212121) or L44 (C2) are indicated) and apparently proteolytically removed from mature native GP265. Similarly, two protein regions that display relative structural flexibility in the GP2 crystals, the β-hairpin and part of the long loop connecting 310 helix B to conserved Cys 2 (white box), contain residues predicted with lower confidence by AlphaFold2.

