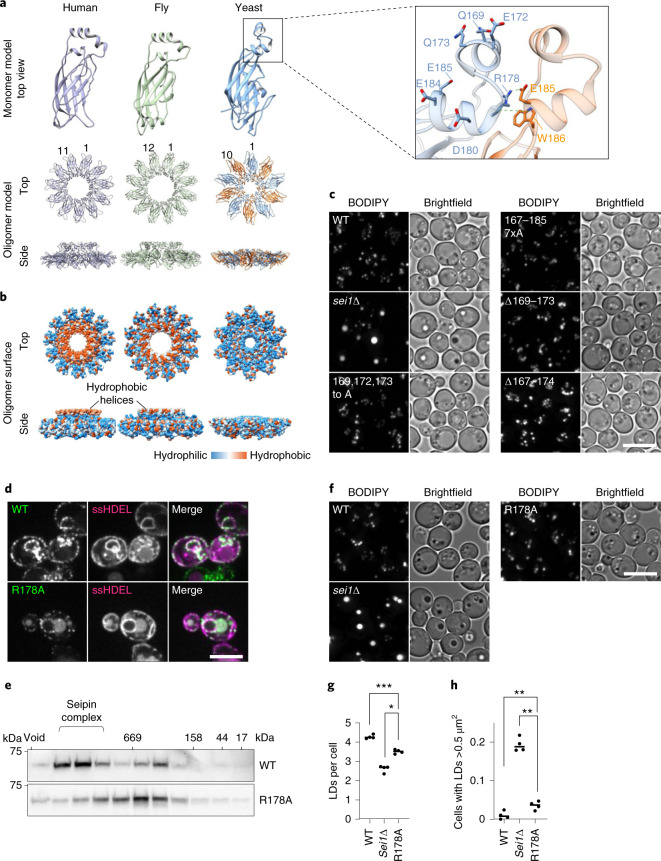
Fig. 2. Interactions of seipin lumenal domains are sufficient for oligomerization but are not required for seipin function.
a, Comparison of seipin lumenal domain structural models of monomers and oligomers from fly (PDB 6MLU), human (PDB 6DS5) and yeast. Magnified box shows detailed view of yeast central helix, including neighboring monomer. b, Hydrophobic surfaces of human, fly and yeast seipin lumenal domains indicate hydrophobic helices present in human and fly, but not yeast seipin. Blue indicates the least hydrophobic and orange the most hydrophobic residues based on the Kyte–Doolittle scale. c, LD morphology of strains expressing central helix mutants from seipin genomic locus. Cells were grown to high density and LDs were stained with BODIPY. Scale bar, 5 µm. d, WT and R178A localize normally to the ER and form seipin foci. C-terminal GFP-tagged WT and R178A expressed from plasmids in sei1∆ cells. ssHDEL was also expressed from a plasmid. Scale bar, 5 µm. e, Seipin WT shows two peaks in size-exclusion chromatography of membrane extract in Triton X-100 from cell expressing SEI1-13xmyc WT and R178A mutant from endogenous promoter. Immunoblot with anti-myc antibodies. Representative of two biologically independent experiment repeats is shown. f, Microscopy analysis of cell expressing indicated seipin mutants from endogenous locus driven by PGK1 promoter with C-terminal 13xmyc tag or deleted for seipin (sei1∆). Staining as in c. Scale bar, 5 µm. g,h, Quantification of LD morphology from the experiment shown in f. LDs per cell (g) and cells with LD area >0.5µm2 (h) were analyzed from n = 4 biologically independent experiments. Data were analyzed with one-way ANOVA and Holm–Sidak’s post hoc comparisons; *P < 0.05; **P < 0.01; ***P < 0.001. Graphs indicate mean value; one dot indicates one separate experiment.

