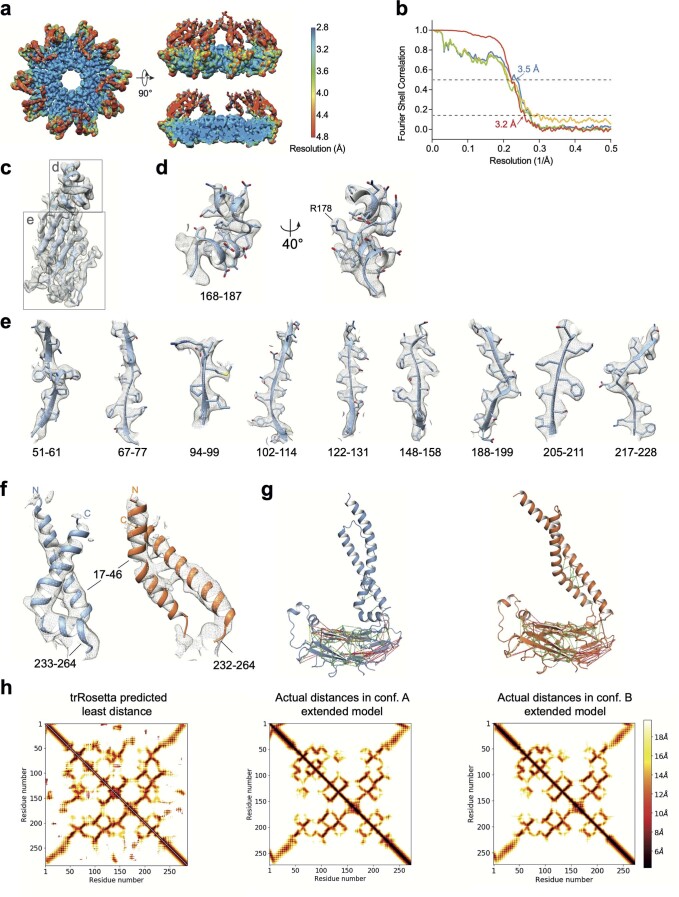
Extended Data Fig. 3. Single-particle cryo-EM analysis of Sei1-Ldb16 complex.
(a) Local resolution mapped onto EM density map using Resmap43 shows differences between lumenal and transmembrane regions of the map. (b) FSC curves: gold-standard FSC curve between the two half maps with indicated resolution at FSC = 0.143 (red); half-map 1 (green), half-map 2 (orange) and the atomic model refined against half map 1 (blue). (c-e) Superimposed cryo-EM densities from sharpened map with atomic model for central alpha-helices (d) and individual beta-sheets (e). (f) Superimposed cryo-EM densities from unsharpened map with atomic model for TM segments of conformation A (blue) and conformation B (orange). (g) Extended models for conformation A (left) and B (right). Residues at least 10 residues apart in the primary sequence predicted to have beta-carbons interacting within 10 Å distance, with maximal probability and over 70% probability mass, mapped onto the final model of conformation A (left) and B (right). Green indicates that the actual distance is within 10Å, yellow within 12Å, and red for >12Å. (h) The predicted and actual distances between beta-carbons of residues in the seipin monomer. The color of each pixel corresponds to the distance in Å between these atoms. Plotted on the left is the least distance predicted by trRosetta for each pair of CB atoms. In the middle are actual distances in conformations A, and conformation B (right). The trRosetta pipeline correctly predicts interactions between the N- and C-terminal helices for both conformations (from residues 10–40 and 250–280).

