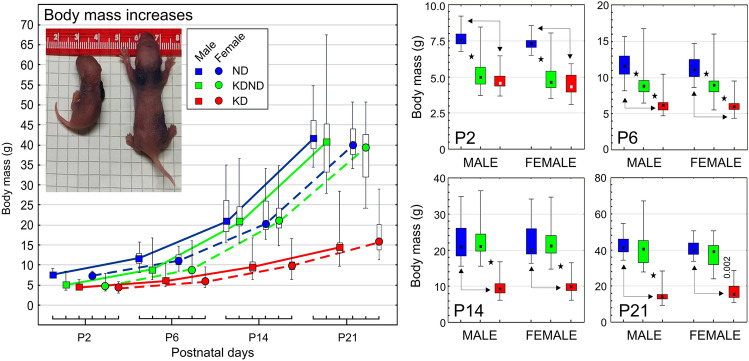
Fig. 10.
Developmental increases in the body mass of rat pups. An inserted photograph shows representative examples of 2-day-old pups born by KD- (left) and ND-fed (right) females. Details of intergroup relations on P2, P6, P14 and P21 are shown in diagrams with respective labels. The pups from females fed exclusively with the normal (ND) and ketogenic (KD) diets, and pups originating from females initially receiving KD, which on day 2 postpartum was replaced with ND (KDND), are indicated according to the inserted legend. The results are shown as medians with Q25, Q75, minima and maxima (small squares, boxes and whiskers, respectively). Asterisks and double-headed arrows indicate intergroup differences statistically significant at levels not lower than 10–6, except for that significant at p < 0.002 (nonparametric Mann–Whitney U test)

