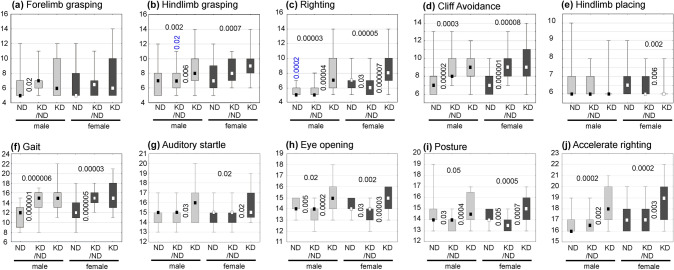
Fig. 11.
Results of neurodevelopmental tests related to days of postnatal development shown separately for male and female pups. It is noteworthy that in these graphs higher values indicate greater developmental delays in obtaining positive results. Abbreviations: offsprings of females fed continuously with normal (ND, grey boxes) or ketogenic (KD, black boxes) diets during their pregnancy and lactation periods. Offspring of females fed with KD during pregnancy and up till the 2nd postnatal day and, thereafter, with ND (symbolized as KDND) are represented by grey boxes. The results are shown as medians (small squares) with Q25 and Q75 (boxes), and minima and maxima (whiskers). Vertically oriented decimal indexes show levels of statistical significance (Mann–Whitney U test) between two animal groups represented by adjacent graphs. Horizontally oriented indexes characterize differences between offsprings of ND- and KD-fed females. Vertical indexes in blue, located over whiskers in (b) and (c), refer to statistical significance of differences between corresponding male and female groups

